Monitoring Drupal With Opsview
 In this post we'll show you how to use the nagios monitoring plugin to monitor your Drupal CMS installation using Opsview's application monitoring software.
With this module you'll be able use Opsview tell you if your Drupal website is running as expected, including:
- PHP is parsing scripts and modules correctly (in case PHP gets disabled for some reason)
- The database is accessible from Drupal
- Whether there are configuration issues with the site, such as:
- Pending Drupal version or module updates
- Unwritable 'files' directory
- Pending updates to the database schema
- Cron not running for a specified period
- Anything else reported in the Administer -> Reports -> Status report (requirements)
Pre-requisites
To be able to make the configurations in this blog post you'll need admin access on both the Drupal server and on the Opsview system. You will need to install a Drupal module and then install a Nagios plugin.
On Drupal
Firstly you will need to go to drupal.org and download the Nagios monitoring module.
Add the module to your Drupal server by either copying the file to your server and moving it to the ../modules/ folder, then extracting
tar –zxvf nagios-7.x-1.2.tar.gz
or navigate to your Drupal GUI and via the “Modules” page, click “Install new module” and paste the hyperlink above.
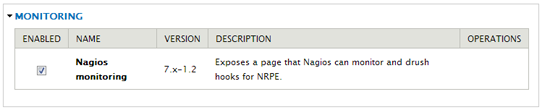
Once the module is installed you will need to activate it and then configure it. Firstly navigate to the modules page and find the “Nagios monitoring” module in the “Monitoring section”, then enable it:
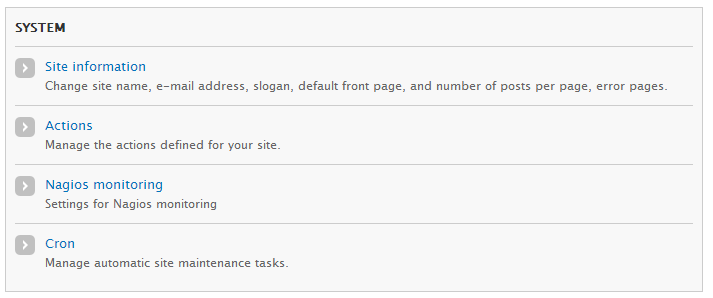
Next, after enabling the module, you must configure it. On Drupal Version 7, navigate to “Configuration > System > Nagios Monitoring”:
On this page, you need to set the “Unique ID” for the Drupal site, as below:
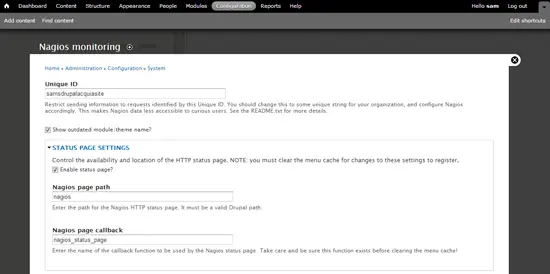
Drupal is now configured for monitoing with Opsview.
On Opsview: Command Line
Download the “check_drupal” plugin from the Nagios Exchange and copy it to your Opsview system.
On the Opsview system, move the plugin to /usr/local/nagios/libexec and ensure the permissions are correctly set:
chown nagios:nagios /usr/local/nagios/libexec/check_drupal && chmod +x /usr/local/nagios/libexec/check_drupal
Change to the nagios user
su – nagios
and run a test command using the unique ID you set above.
[nagios@localhost libexec]$ ./check_drupal -U samsdrupalacquiasite -H 192.168.0.16/acquia
DRUPAL CRITICAL, ADMIN:CRITICAL=Configuration file, Drupal core update status, CRON:OK | SAN=0;SAU=1;NOD=1;USR=1;MOD=34;THM=4
As above, you can now see that the plugin is talking to the Drupal module correctly. If you see an error such as:
[nagios@localhost libexec]$ ./check_drupal -H 192.168.0.16/acquia
wget error: 8: when accessing 192.168.0.16/acquia/nagios. HTTP: HTTP/1.0 404 Not Found
Then the “-U uniqueid” is not specified in the command, or set via the Drupal module.
As the test is successful you can now proceed to building service checks to monitor your Drupal site.
On Opsview: GUI
Login to your Opsview system via the GUI and then “Settings > Service Checks” and add a new service check via the “plus” icon in the top left.
In the newly loaded section, populate with the options / details as per your system. Example below:
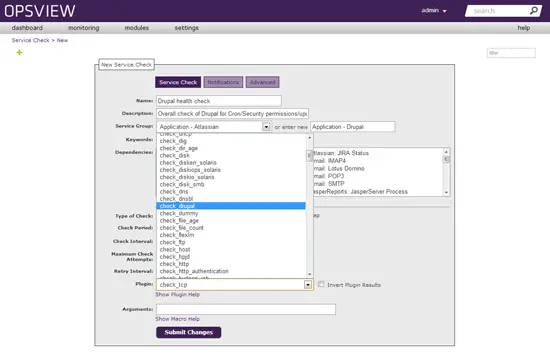
In the section above, ensure you choose the newly added “check_drupal” plugin. In the arguments section, specify something similar to the following:
-U samsdrupalacquiasite -H $HOSTADDRESS$/acquia
Where samsdrupalacquiasite is replaced with your unique ID you set earlier in this document via the Drupal GUI, and your URL replaces /acquia. This is because it seems Opsview cannot run the check commands (ping, etc) against an “IP/domain” style address. This -H .. option can be modified however, to your specific environment.
Once your service check is created, navigate to “Settings > Hosts” and add a new host and populate similar to below, replacing the hostname etc with your details instead:
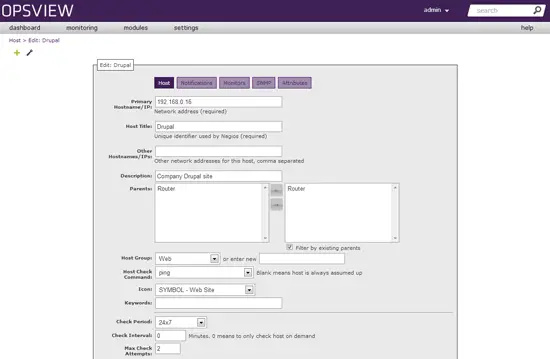
For clarity, the only important setting in the above for the purpose of this document is the “Primary Hostname/IP:”, this should be your URL for the Drupal server, i.e. company.com for example.
Once configured, at the bottom of the above page click “Next” and then click on the “Monitors” tab at the top, next to Notifications. Click on “Application –Drupal” (for example, you may have named it differently), and then click on the service check inside this group, as below:
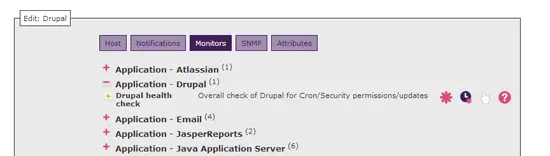
The new service check is now added to your Drupal site. Add any other service checks you would like also via this page, for example “Check HTTP”, etc.
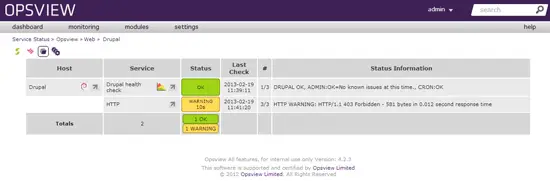
Finally, click “Submit changes” and then reload Opsview (Settings >Apply Changes > Reload) and your settings will be applied. You can now navigate to your host, and view your newly monitored Drupal server:
Posted by: Brian King

