Monitor MySQL connections and queries with mytop
On this page
This article will explain the installation and usage of mytop, a handy tool for live monitoring of MySQL queries. Also looking into various operations that a user can perform while monitoring the queries on mytop.
About mytop
Mytop is a commandline tool that resembles the top command but for motoring MySQL. It requires MySQL 3.22 or later, the current MySQL 5.x versions are supported. It works fine with most Linux systems. For this tutorial I will use Ubuntu as basis. It needs Perl, DBI and Term::ReadKey installed on the system. With Term::ANSIColor you can get color in the output displayed if you want. The version 0.7 works even with windows.
Installation
As I have already given the information about other tools and applications required for the functionality of mytop in the Intro, I'll directly start with the installation of mytop:
Debian:
apt-get install mytop
Ubuntu:
sudo apt-get install mytop
Or else, if you are willing to download the tar ball from the website and installing it then:
tar -zxvf mytop-x.x.x.tar.gz (Your version number)
 cd mytop-x.x.x. (Your version number)
 perl Makefile.PL
 make
 make test
 make install
Type in the above commands to extract the data and finish the installation. For CentOS and RedHat users you will have to download rpmforge repository to install it automatically, or else you can go on with the manual method instead.
Using mytop
After the installation, its time to use mytop:
mytop --prompt (this will give you a password prompt, simply hit enter and you will be through)
Above is the default way, you can also type this :
mytop -u root -p (in here you will have to use your mysql password, because you are specifying a user "root" here)
If the above command returns an error like "root : NO PASS" or anything, try this:
mytop -u root -p xxxx ("xxxx" stands for your password)
Please check if your MySQL server is up and running before typing any of the above commands.
Once you are done, just hit enter and it should return something like this:
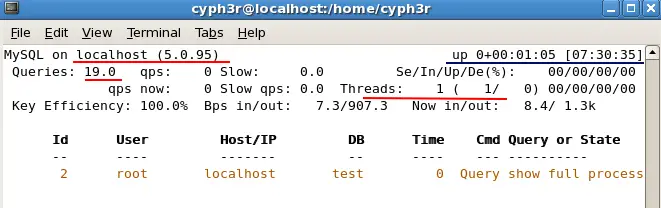
The very first line indicates the name of the server (localhost) and also the version of MySQL running on your system. The line marked with blue indicates the uptime of the MySQL server in days+hours:minutes:seconds format and besides is the current time on the system.
The second line indicates the the nummber of queries the server has handled since uptime.
Third lines displays the number of threads.
And the second part of the image shows the list of threads handled by MySQL. they are sorted according to their idle time least idle first. You can see the information and understand it easily.
There are some arguments that you can pass with mytop such as:
-u or user username: Basically used to definne the username while loginig in to mytop. The default is set to "root".
-p or pass or password password: Passwords used for the user login. The default password is just empty or none or just say leave the password field blank.
-h or host hostname[:port]: To specify ports if MySQL is not using the default port. The deault is set to 3306.
-s or -delay seconds: To specify the time gap for the refreh. The default is 5.
This are some of the arguments of mytop to find out more you may type:
man mytop
The man pages hold more than enough information for anyone to understand anything about mytop.
Just a look at the configuration file you can create for yourself to get easy access and monitoring of your data:
  user=root 		#The user you would like to define.
  pass=             #You can define passwords for your user.
  host=localhost     #your hostaname
  db=test            #your database name.
  delay=5             #time gap to refresh the output of monitoring.
  port=3306           #port you would like mytop to use.
  socket=             #if you specify any socket mytop will ignore the port number and hostname given, you may just delet it if you don't find it usefull.
  batchmode=0      #it avoids the clearing of screen and gives you a direct series of queries being used by MySQL.
  header=1         #Sepcify if you want the header to display or not. You can toggle this with the h key while mytop is running.
  color=1 			#Specify if you want to use any colors in the display (will only work if you have color support).
  idle=1			#if you want to see idle processes in the process list.
You may create the above file by typing:
nano ~/.mytop (this has to be created in your home folder and you may use any editor you feel like.)
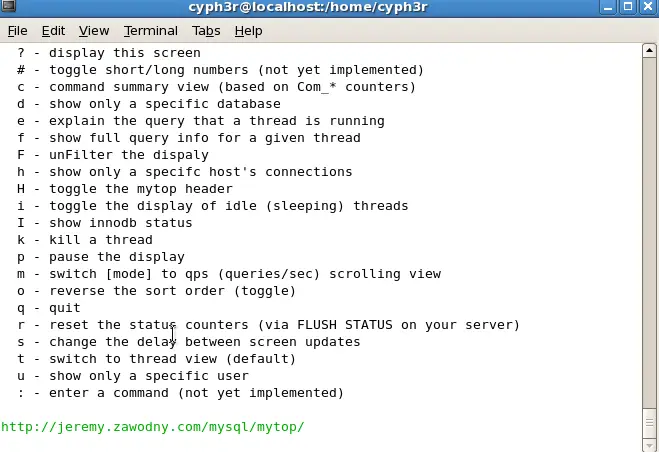
You may just check some other options in mytop by typing: ?. It will give a whole page of keyboard shorcuts that you can use in mytop.
This is all of the tutorial you can go around and check the man page as I specified earlier. You can get each and every information upto date from your man pages after installation...

