Installing and Using the Scientific Software GNU Octave on Ubuntu 15.04
What is GNU Octave? Octave is a scientific application that uses a Matlab-like interpreted high-level language for numerical computations and simulations. It offers functions to solve linear and nonlinear problems, can plot the results as graphics and offers capabilities for data manipulation and visualization. GNU Octave provides an interactive command line interface and a GUI interface but can also be used in noninteractive scripts for data processing.
The version that we will install on Ubuntu 15.05 as part of this tutorial comes with a native GUI similar to Matlab, with a built-in editor, browser window, command history, documentation and debugging tools.
Download and Install Octave
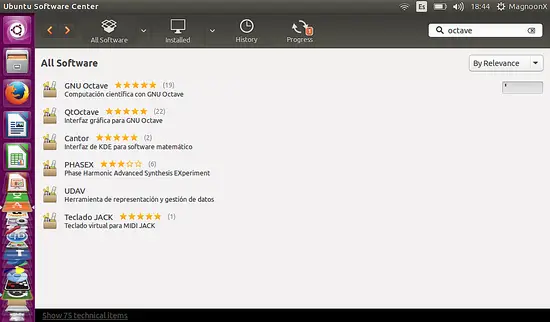
We can install Octave 3.8.1 from Ubuntu software center as shown below:
Or alternatively on the shell by running this command:
sudo apt-get install octave
Starting Octave
There are two ways to start Octave, with the shell command or through the GUI. Octave does not start the Graphical User Interface by default when started on the shell, that's why I use the '--force-gui' option on the command line.
Open a shell in Ubuntu and invoke Octave by using this command:
octave --force-gui
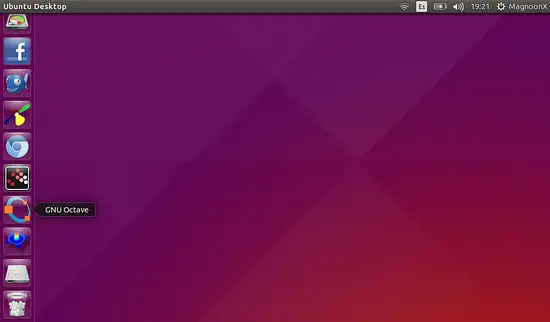
Or we can start Octave trough it's icon on the left sidebar
In any case, we can use the power of Octave commands, either for calculations or to make a graphical analysis of mathematical functions.
Examples using Octave
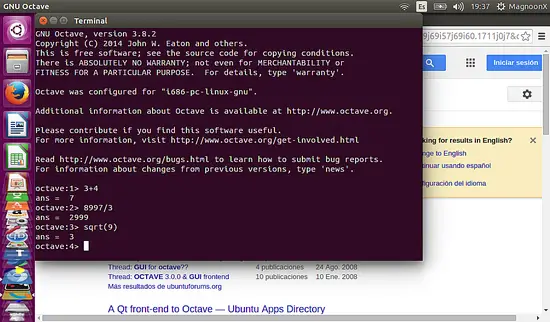
Example 1: Simple Calculations
Enter the following line on the Octave shell:
>> 3 + 4
to sum up three plus four. Or enter:
>> 8997 / 3
to calculate the split of 8997 from 3 and type:
>> sqrt(9)
to calculate the square root of a number, in this case, 9.
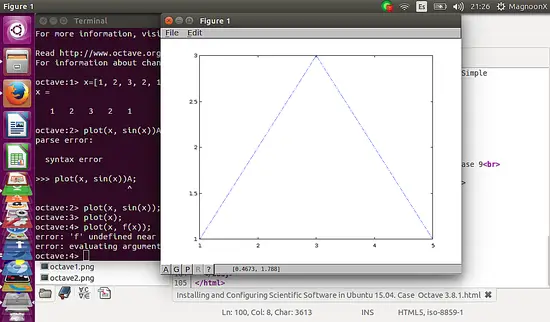
Example 2: plotting mathematical functions
Type in the next commands:
>> x=[1, 2, 3, 2, 1]
>> plot (x);
Please note the semicolon at the end of the last command.
A window like this will show the plot of the function:
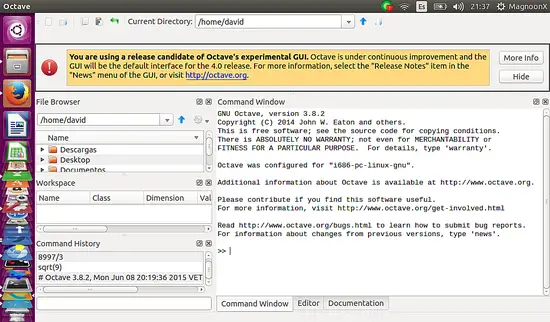
Graphical User Interface (GUI)
If we are going to use the Graphical User Interface, rather than the Octave command terminal, this will show up as follows:
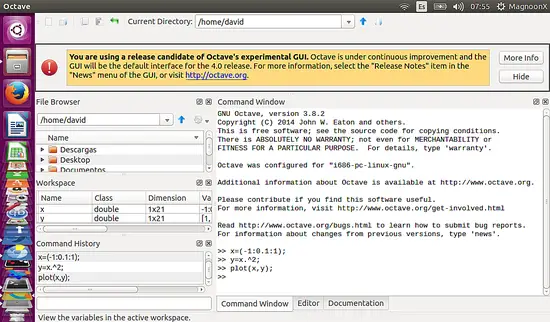
Please, type:
>> x=(-1:0.1:1);
>> y=x.^2;
>> plot(x,y);
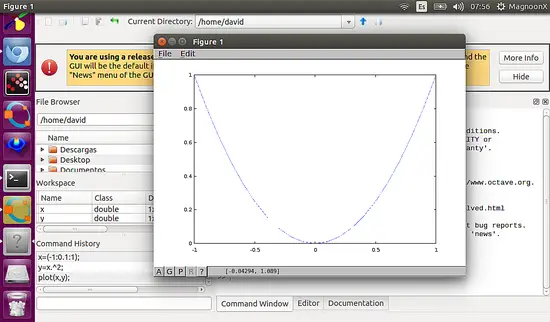
as follows:
This will open a new window with the plot of the function you entered
In the next tutorial, we will discuss the more advanced features, including PC peripheral devices and connecting Linux scripts with Scientific software. We will also study in depth the layout of the Octave GUI such as the Workspace, the Command History, the File Browser and other functions of the software.
Enjoy!!

