How to prepare for bad weather on Linux
Severely bad weather is one of the few things that can still awe people while causing large-scale catastrophes. Especially if you live in the US, you most likely have witnessed a dangerously large storm during the tornado season. Preparing for those situations is crucial for the safety and survival of you and your family, and while you can always keep an eye on the news for weather reports, you can also use your Linux system to draw conclusions yourself. There are a couple of free software tools that offer more “specialized” information that goes well beyond air speed and temperature.
AWeather
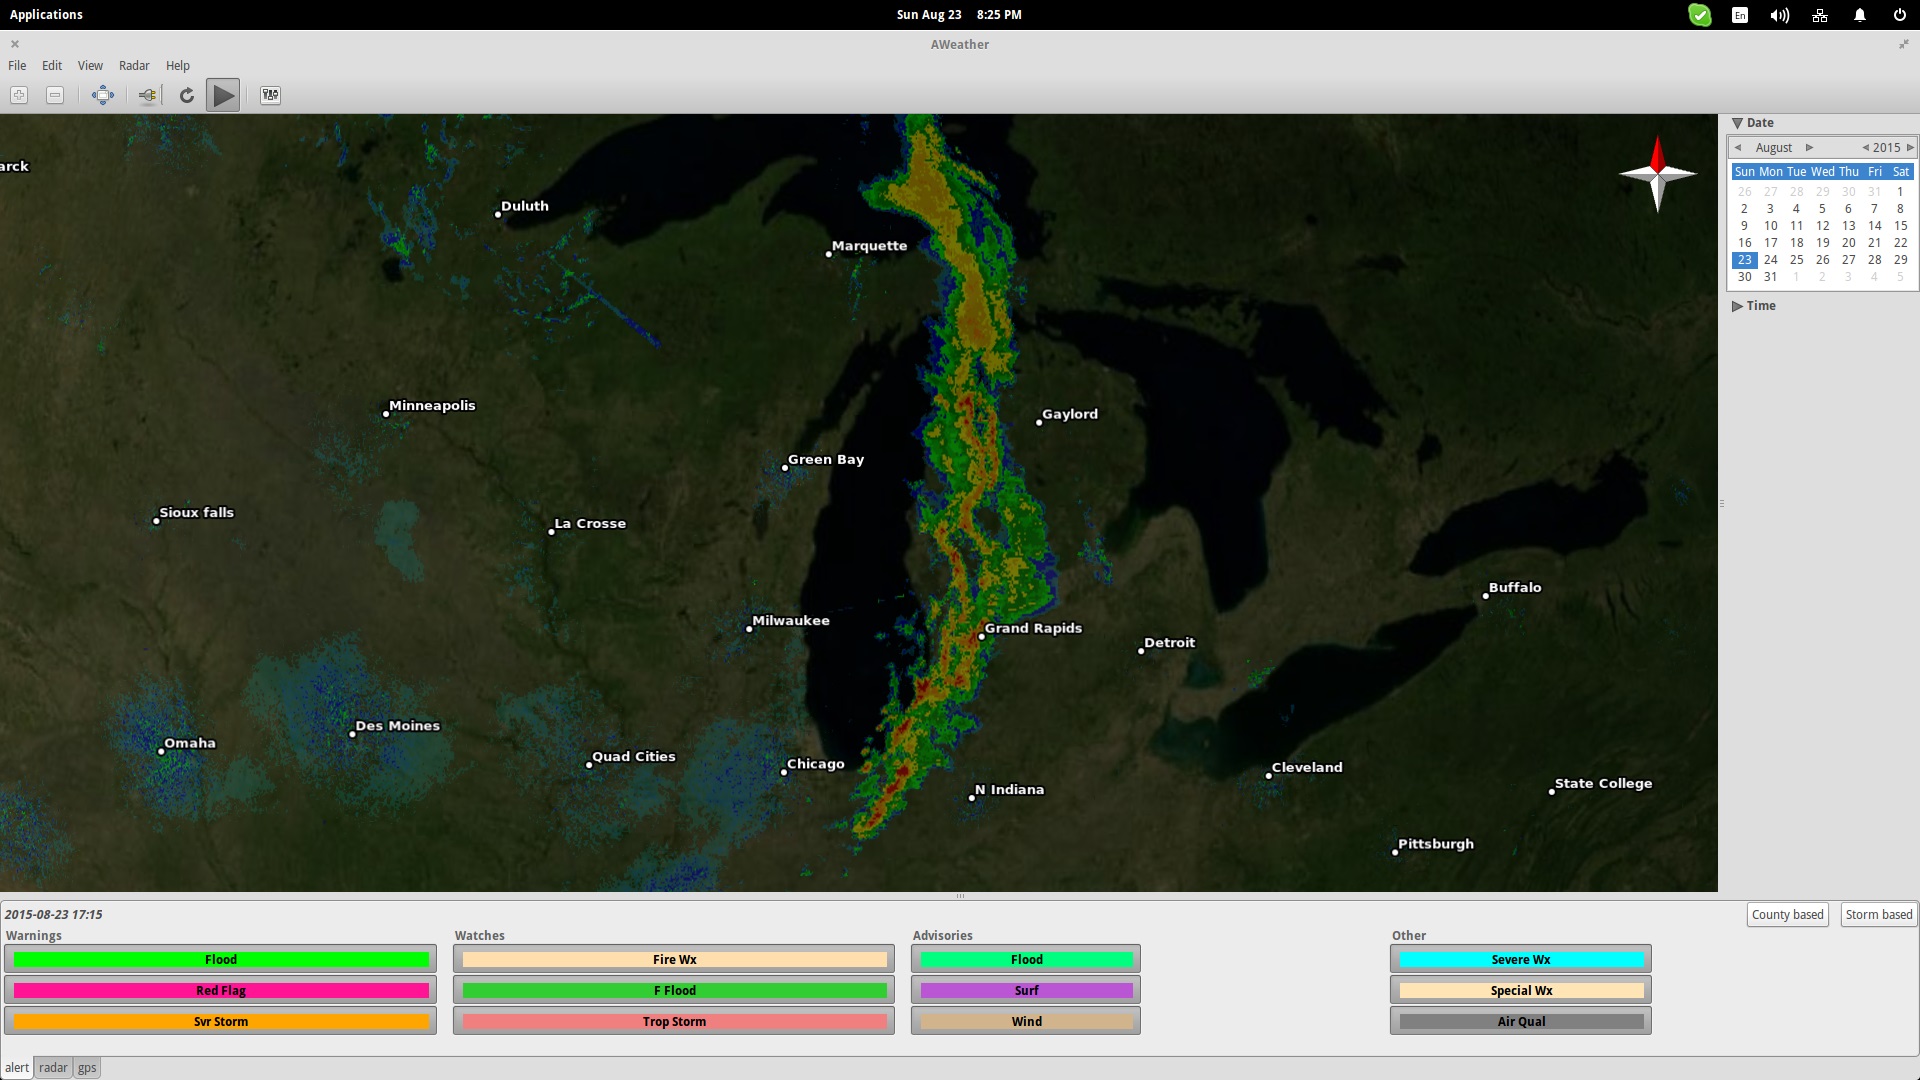
AWeather is a meteorological application that features a virtual world globe and draws data from various US-based weather stations and radars. The result is the depiction of colored zones according to the type of the warning.
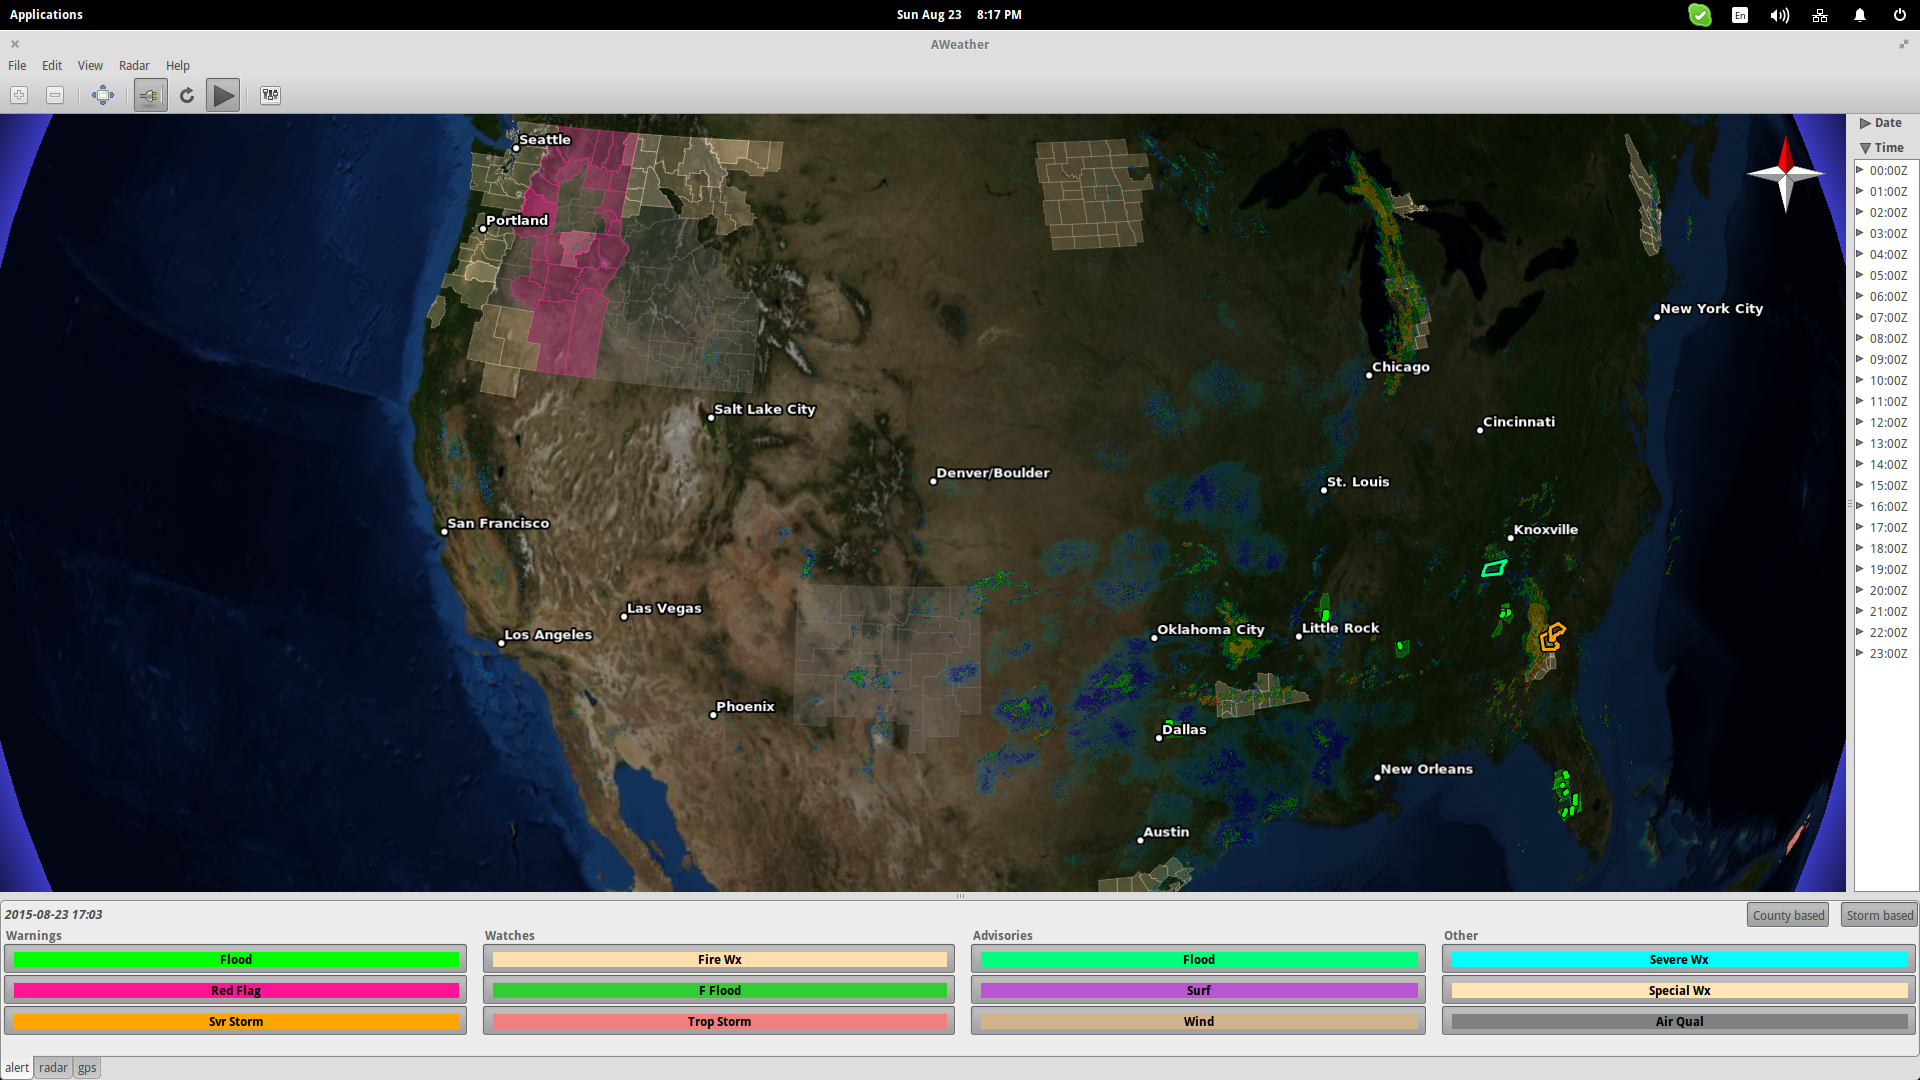
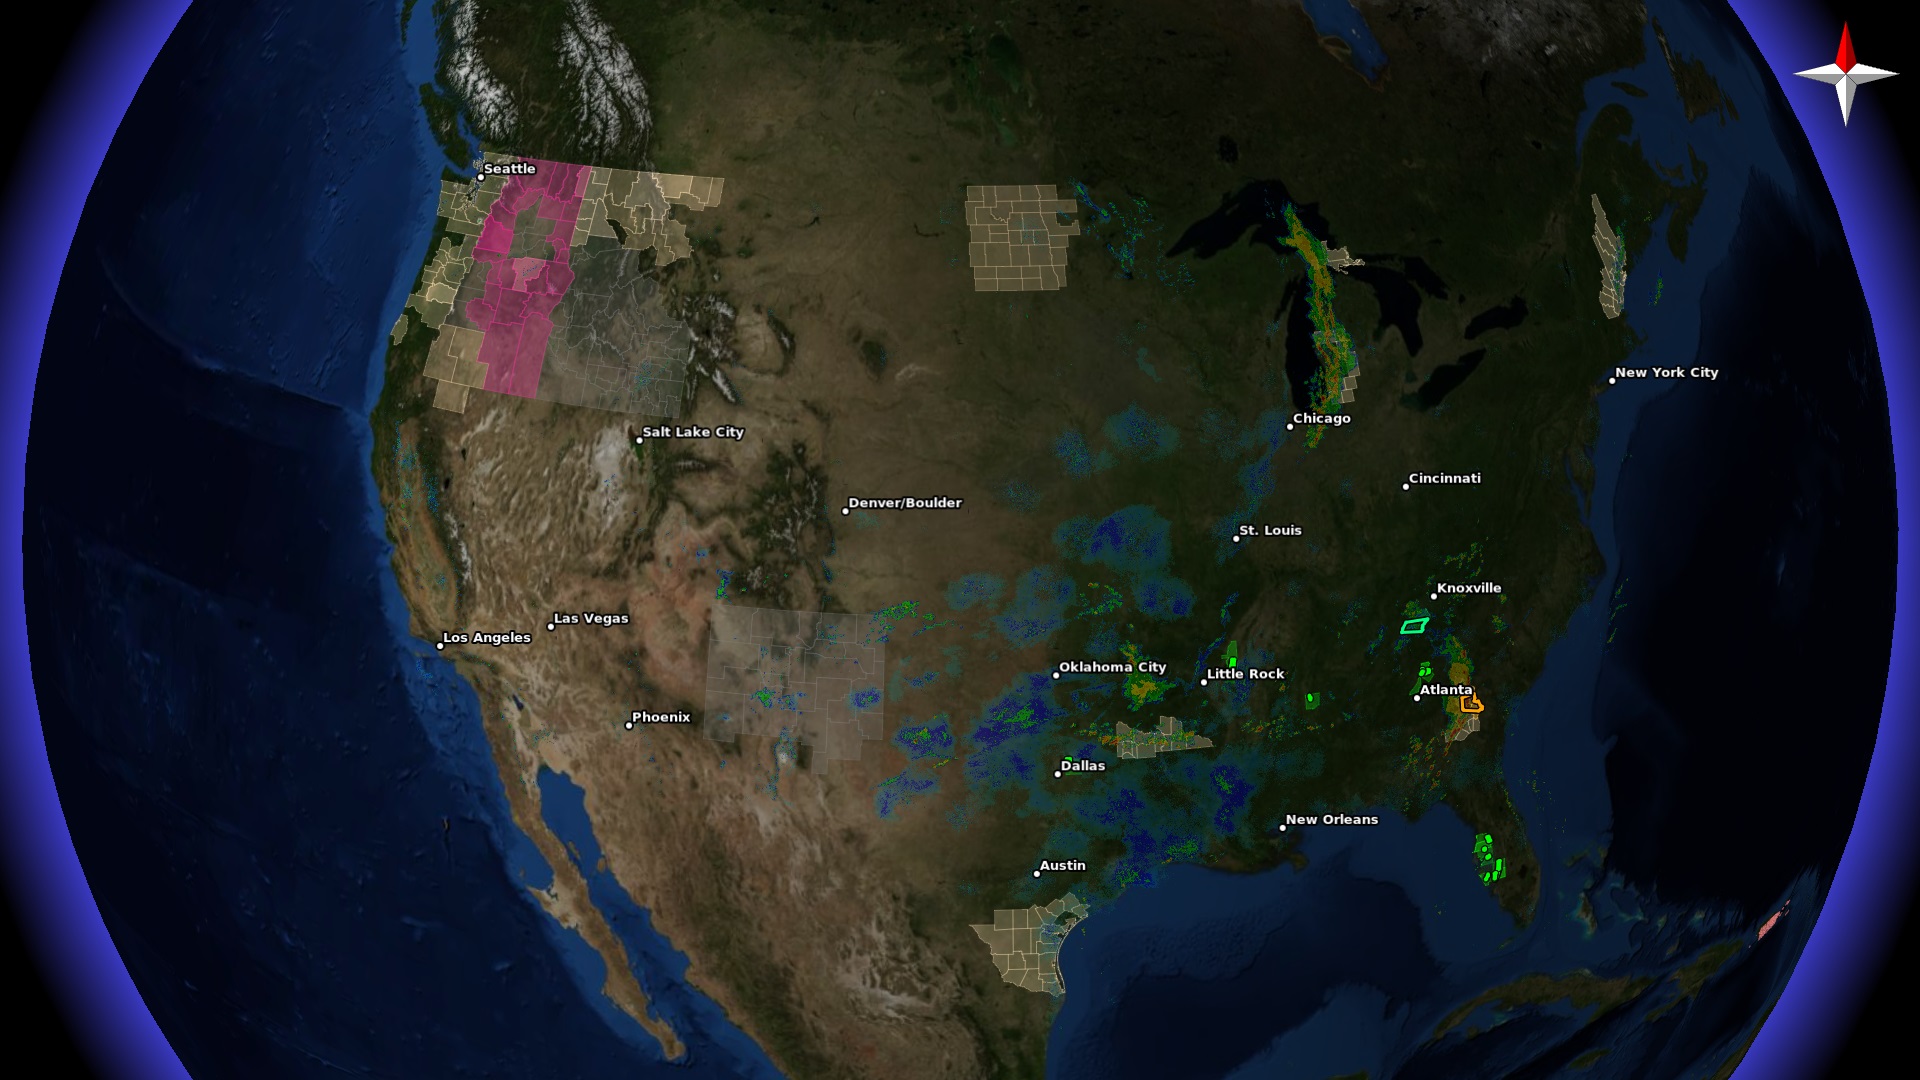
Users may enable or disable warning types by pressing the corresponding buttons located on the bottom of the application, and enter full screen mode to get a better overview of the country through the “View” menu on the top.
Clicking on a zone of interest will result in the opening of a dialog that contains at least a part of the official warning as issued in text form. There's also an option to read the “Full text” on NOAA's website.
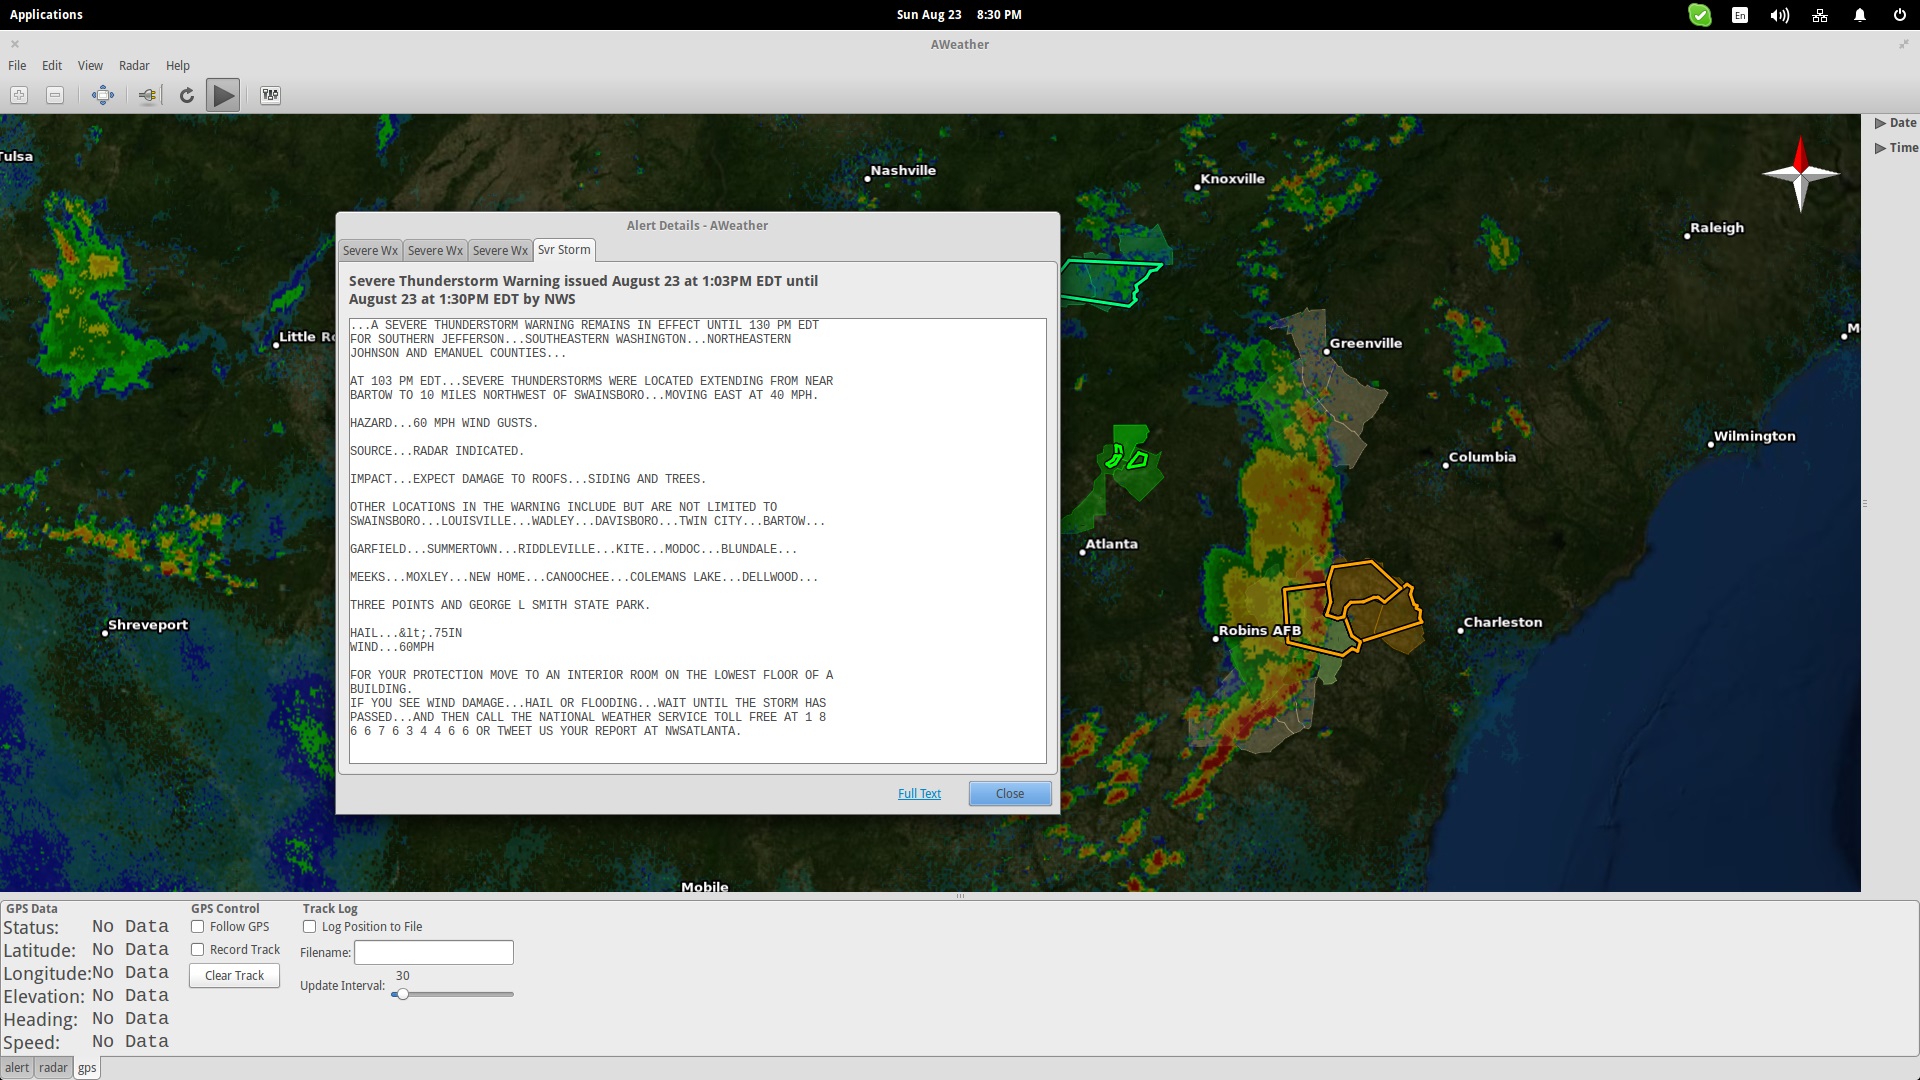
Users may also change the date (and time) to get forecasts, or use data from previous days to run simulations on other applications. This can be done from the date selector on the right.
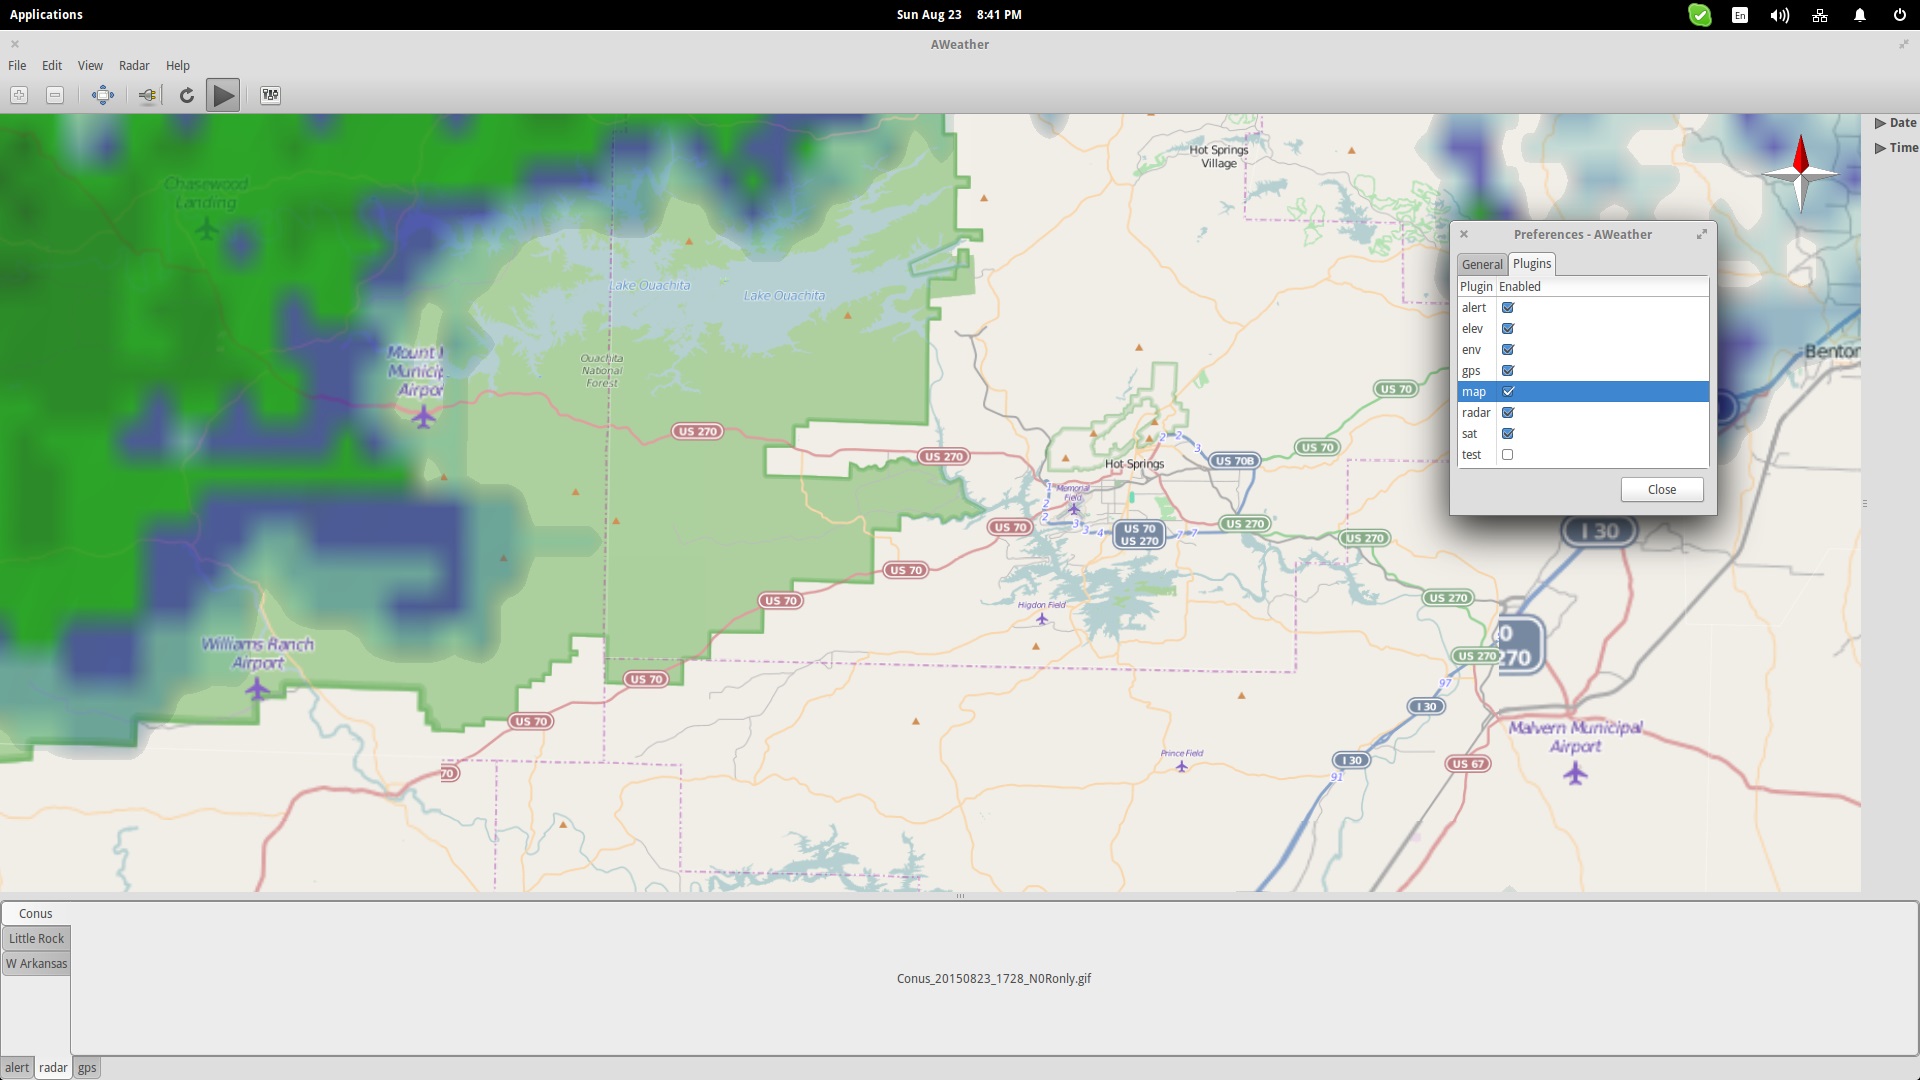
From the “Preferences” menu, you can change the view of the rendered globe to a map mode by selecting the “map” plugin. This is very helpful when wanting to determine what roads are safe to use when traveling.
Contrary to most meteorological tools available in Linux, AWeather is very user-friendly, making it suitable for use not only by professionals but almost everyone out there. Feel confident to trust it in cases of emergency, as the data are drawn from the National Oceanic and Atmospheric Administration and are considered to be very reliable. When a radar/weather station has an operation problem, it is indicated to the user and sometimes there's even a forecast on when the radar will get back to normal operation. You can check the status of a station by selecting it on the map (or through the “Radar” menu on the top) and clicking the “View Radar Status” on the bottom. This will open up a web page on your browser, detailing the status of the radar.
XTide
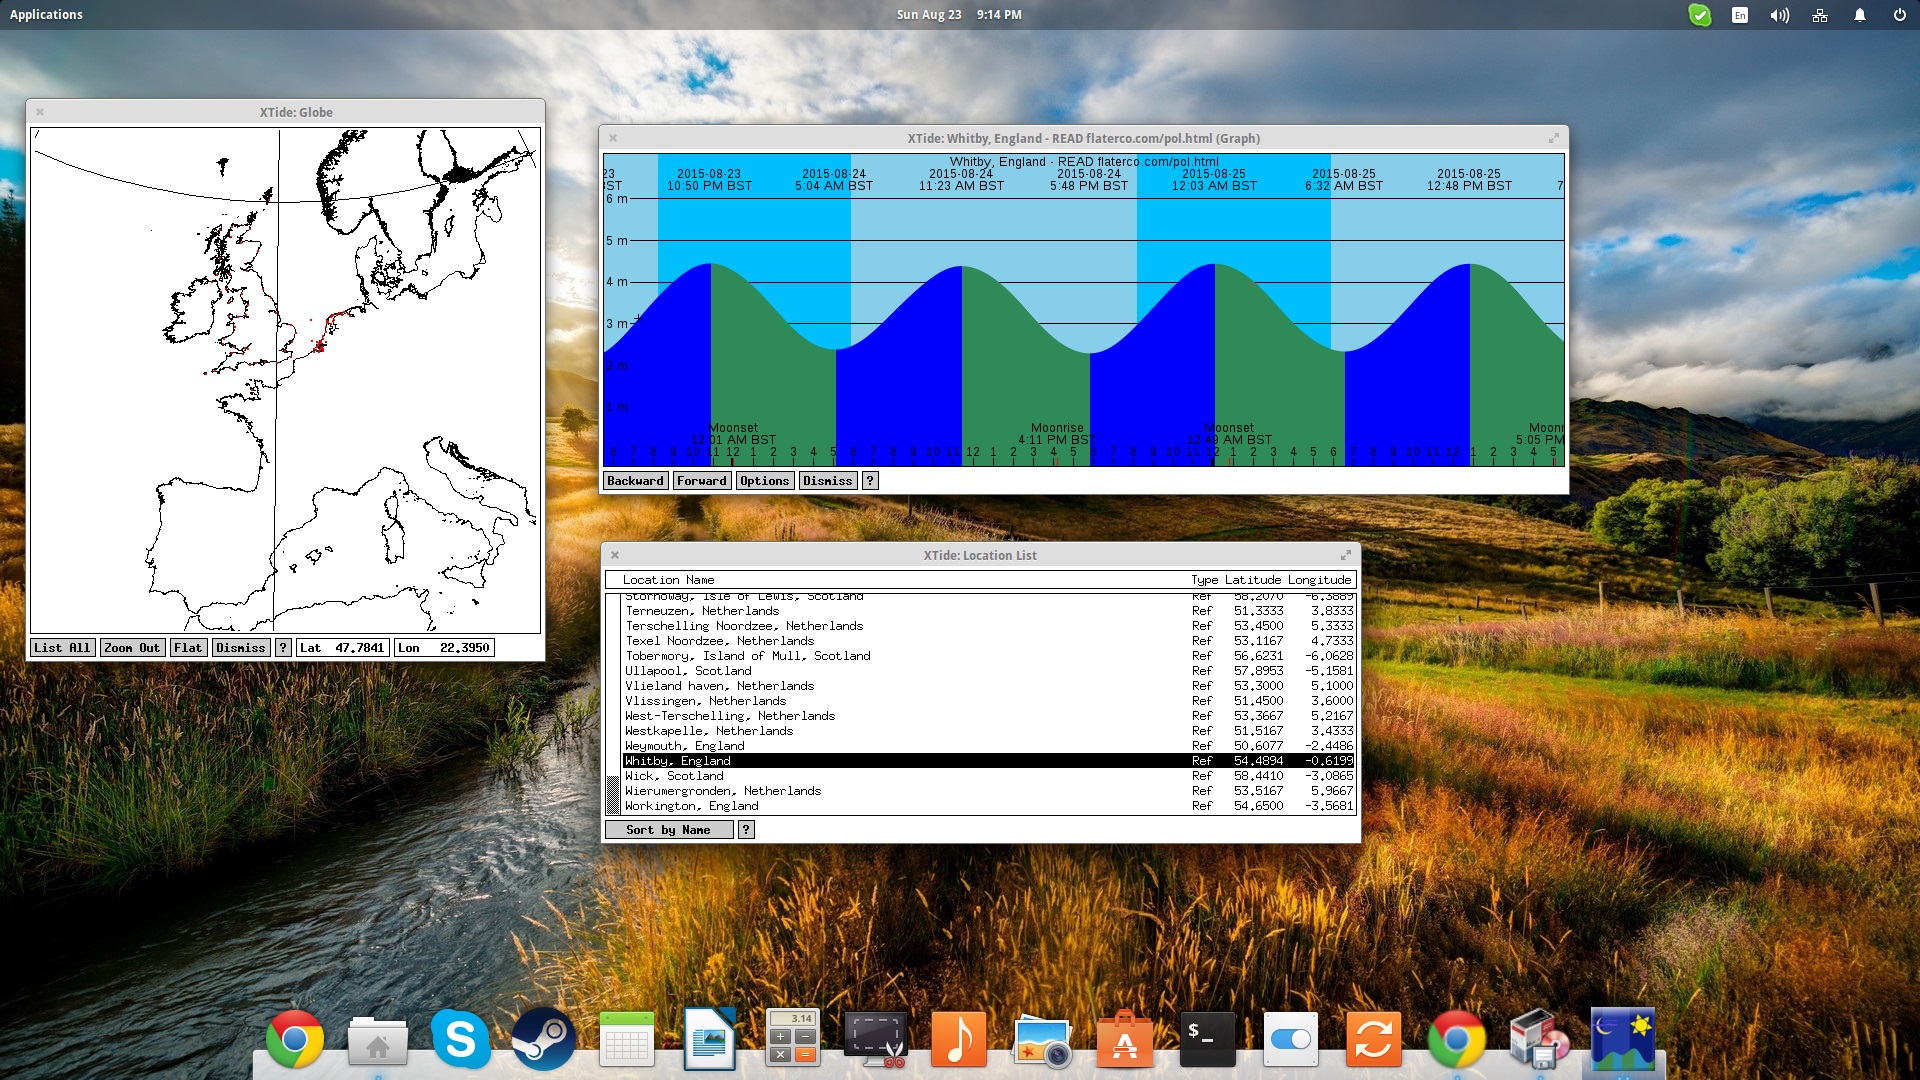
XTide can be used as a complementary application to Aweather in order to get detailed information regarding tides in the US. You can simply choose a location from the list and a tide diagram will open up. Press and hold the “Forward/Backward” buttons on the bottom and the tide diagram will change to depict the forecast.
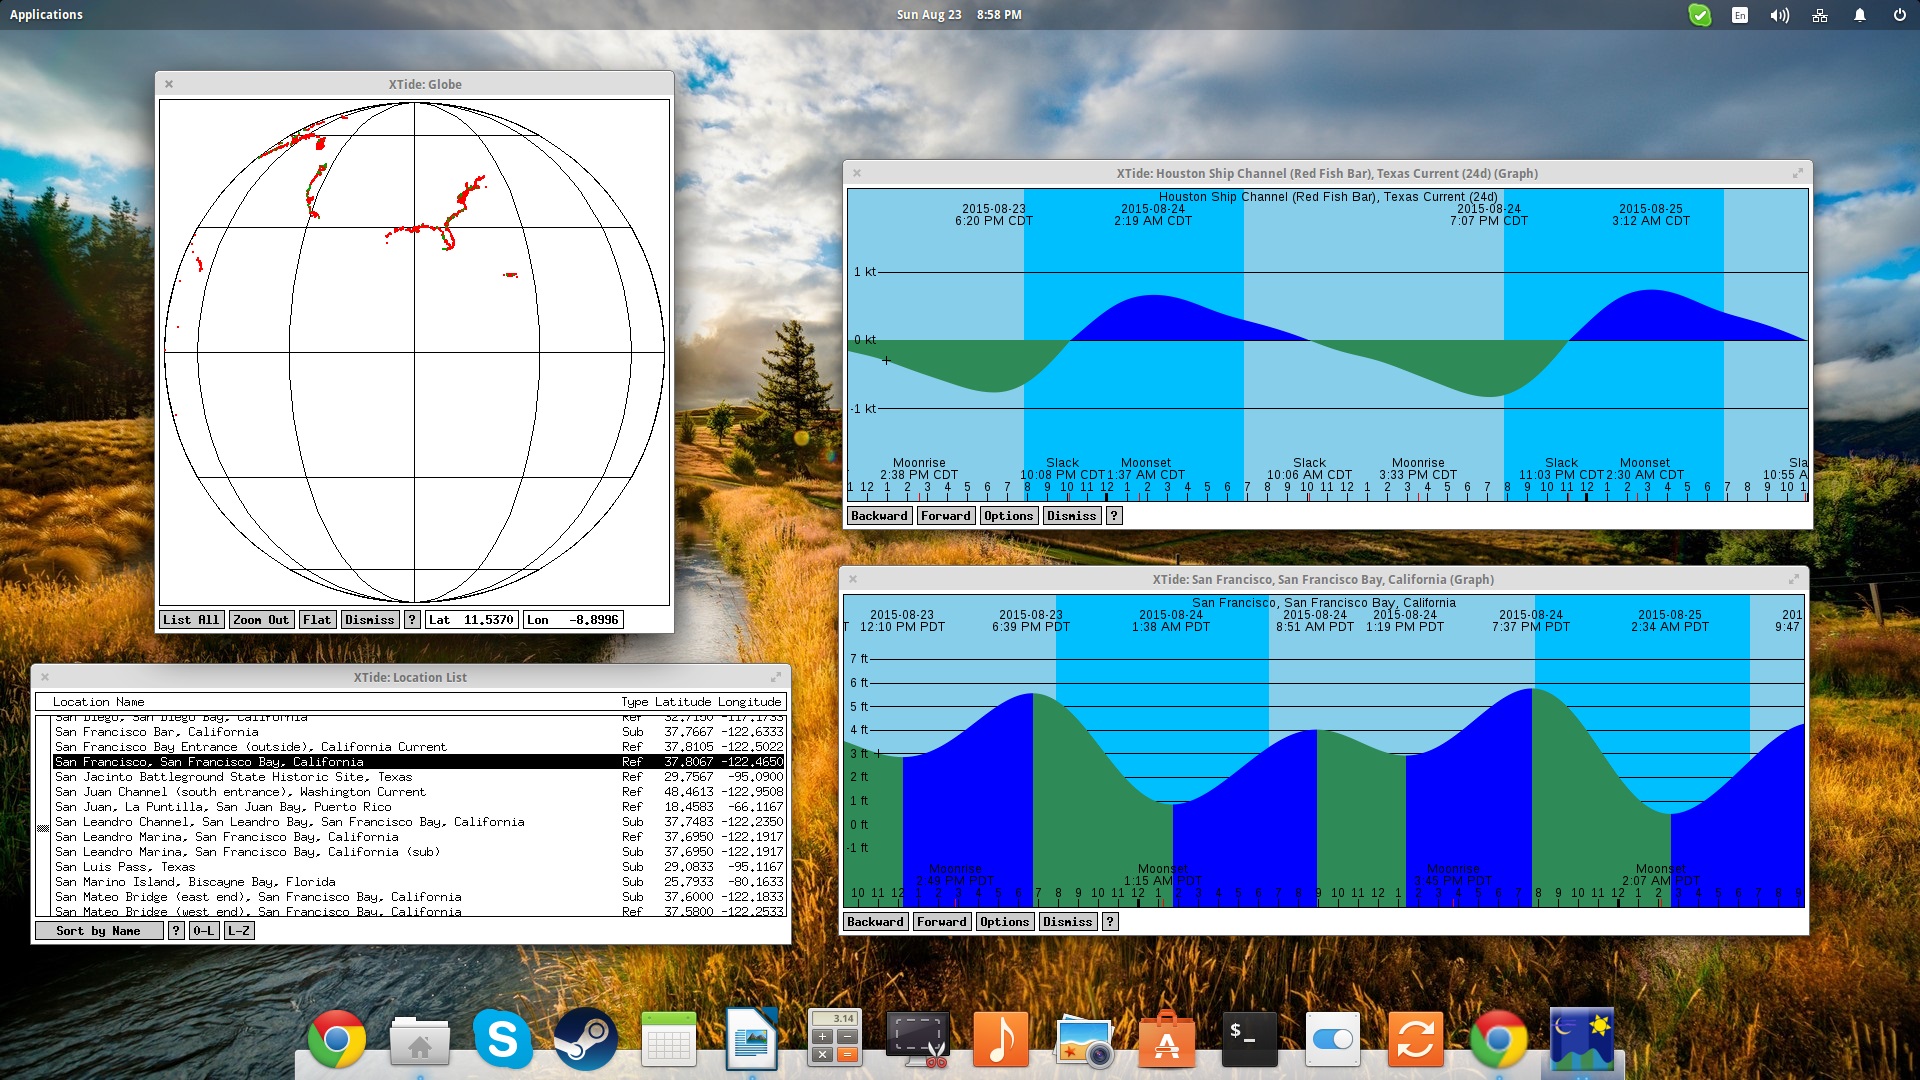
Take into account that there may be more than one option for a particular place, and this is due to the fact that XTide uses both reference stations and subordinate stations from NOAA to calculate the harmonic constants and yield reliable results. However, and as more than 70% of the stations used are over 30 years old of age, some results may be inaccurate. You can compare the data with the real situation and evaluate if XTide is useful enough in your area.
XTide supports by default the US coastline stations, but you can install the “xtide-data-nonfree” package to get support for stations in Canada, Netherlands, Germany and the UK. Moreover, if you want the coastline to show up on the map, you may also install the “xtide-coastline” package.