
The buffer overflow has long been a feature of the computer security landscape. In fact the first self-propagating Internet worm—1988's Morris Worm—used a buffer overflow in the Unix finger daemon to spread from machine to machine. Twenty-seven years later, buffer overflows remain a source of problems. Windows infamously revamped its security focus after two buffer overflow-driven exploits in the early 2000s. And just this May, a buffer overflow found in a Linux driver left (potentially) millions of home and small office routers vulnerable to attack.
At its core, the buffer overflow is an astonishingly simple bug that results from a common practice. Computer programs frequently operate on chunks of data that are read from a file, from the network, or even from the keyboard. Programs allocate finite-sized blocks of memory—buffers—to store this data as they work on it. A buffer overflow happens when more data is written to or read from a buffer than the buffer can hold.
On the face of it, this sounds like a pretty foolish error. After all, the program knows how big the buffer is, so it should be simple to make sure that the program never tries to cram more into the buffer than it knows will fit. You'd be right to think that. Yet buffer overflows continue to happen, and the results are frequently a security catastrophe.
To understand why buffer overflows happen—and why their impact is so grave—we need to understand a little about how programs use memory and a little more about how programmers write their code. (Note that we'll look primarily at the stack buffer overflow. It's not the only kind of overflow issue, but it's the classic, best-known kind.)
Stack it up
Buffer overflows create problems only for native code—that is, programs which use the processor's instruction set directly rather than through some intermediate form such as in Java or Python. The overflows are tied to the way the processor and native code programs manipulate memory. Different operating systems have their own quirks, but every platform in common use today follows essentially the same pattern. To understand how these attacks work and some of the things people do to try to stop them, we first have to understand a little about how that memory is used.
The most important central concept is the memory address. Every individual byte of memory has a corresponding numeric address. When the processor loads and stores data from main memory (RAM), it uses the memory address of the location it wants to read and write from. System memory isn't just used for data; it's also used for the executable code that makes up our software. This means that every function of a running program also has an address.
In the early days of computing, processors and operating systems used physical memory addresses: each memory address corresponded directly to a particular piece of RAM. While some pieces of modern operating systems still have to use these physical memory addresses, all of today's operating systems use a scheme called virtual memory.
With virtual memory, the direct correspondence between a memory address and a physical location in RAM is broken. Instead, software and the processor operate using virtual memory addresses. The operating system and processor together maintain a mapping between virtual memory addresses and physical memory addresses.
This virtualization enables a range of important features. The first and foremost is protected memory. Every individual process gets its own set of addresses. For a 32-bit process, those addresses start at zero (for the first byte) and run up to 4,294,967,295 (or in hexadecimal, 0xffff'ffff; 232 - 1). For a 64-bit process, they run all the way up to 18,446,744,073,709,551,615 (0xffff'ffff'ffff'ffff, 264 - 1). So, every process has its own address 0, its own address 1, its own address 2, and so on and so forth.
(For the remainder of this article, I'm going to stick to talking about 32-bit systems, except where otherwise noted. 32- and 64-bit systems work in essentially the same ways, so everything translates well enough; it's just a little clearer to stick to one bitness.)
Because each process gets its own set of addresses, these scheme in a very straightforward way to prevent one process from damaging the memory of any other: all the addresses that a process can use reference memory belonging only to that process. It's also much easier for the processes to deal with; physical memory addresses, while they broadly work in the same way (they're just numbers that start at zero), tend to have wrinkles that make them annoying to use. For example, they're usually not contiguous; address 0x1ff8'0000 is used for the processor's System Management Mode memory; a small chunk of physical memory that's off limits to normal software. Memory from PCIe cards also generally occupies some of this address space. Virtual addresses have none of these inconveniences.
So what does a process have in its address space? Broadly speaking, there are four common things, of which three interest us. The uninteresting one is, in most operating systems, "the operating system kernel." For performance reasons, the address space is normally split into two halves, with the bottom half being used by the program and the top half being the kernel's address space. The kernel-half of the memory is inaccessible to the program's half, but the kernel itself can read the program's memory. This is one of the ways that data is passed to kernel functions.
The first things that we need to care about are the executables and libraries that constitute the program. The main executable and all its libraries are all loaded into the process' address space, and all of their constituent functions accordingly have memory addresses.
The second is the memory that the program uses for storing the data it's working on, generally called the heap. This might be used, for example, to store the document currently being edited, the webpage (and all its JavaScript objects, CSS, and so on) being viewed, or the map for the game being played.
The third and most important is the call stack, generally just called the stack. This is the most complex aspect. Every thread in a process has its own stack. It's a chunk of memory that's used to keep track of both the function that a thread is currently running, as well as all the predecessor functions—the ones that were called to get to the current function. For example, if function a calls function b, and function b calls function c, then the stack will contain information about a, b, and c, in that order.

name, then the frame pointer, and then the return address. esp has the address of the top of the stack, ebp has the address of the frame pointer.The call stack is a specialized version of the more general "stack" data structure. Stacks are variable-sized structures for storing objects. New objects can be added ("pushed") to one end of the stack (conventionally known as the "top" of the stack), and objects can be removed ("popped") from the stack. Only the top of the stack can be modified with a push or a pop, so the stack forces a kind of sequential ordering: the most recently pushed item is the one that gets popped first. The first item that gets pushed on the stack is the last one that gets popped.
The most important thing that the call stack does is to store return addresses. Most of the time, when a program calls a function, that function does whatever it is supposed to do (including calling other functions), and then returns to the function that called it. To go back to the calling function, there must be a record of what that calling function was: execution should resume from the instruction after the function call instruction. The address of this instruction is called the return address. The stack is used to maintain these return addresses: whenever a function is called, the return address is pushed onto the stack. Whenever a function returns, the return address is popped off the stack, and the processor begins executing the instruction at that address.
This stack functionality is so fundamentally important that most, if not all, processors include built-in support for these concepts. Consider x86 processors. Among the registers (small storage locations in the processor that can be directly accessed by processor instructions) that x86 defines, the two that are most important are eip, standing for "instruction pointer," and esp, standing for stack pointer.
esp always contains the address of the top of the stack. Each time something is pushed onto the stack, the value in esp is decreased. Each time something is popped from the stack, the value of esp is increased. This means that the stack grows "down;" as more things are pushed onto the stack, the address stored in esp gets lower and lower. In spite of this, the memory location referenced by esp is still called the "top" of the stack.
eip gives the address of the currently executing instruction. The processor maintains eip itself. It reads the instruction stream from memory and increments eip accordingly so that it always has the instruction's address. x86 has an instruction for function calls, named call, and another one for returning from a function, named ret.
call takes one operand; the address of the function to call (though there are several different ways that this can be provided). When a call is executed, the stack pointer esp is decremented by 4 bytes (32-bits), and the address of the instruction following the call, the return address, is written to the memory location now referenced by esp—in other words, the return address is pushed onto the stack. eip is then set to the address specified as operand to call, and execution continues from that address.
ret does the opposite. The simple ret doesn't take any operands. The processor first reads the value from the memory address contained in esp, then increments esp by 4 bytes—it pops the return address from the stack. eip is set to this value, and execution continues from that address.
call and ret in action.If the call stack only contained a sequence of return addresses, there wouldn't be much scope for problems. The real problem comes with everything else that goes on the stack, too. The stack happens to be a quick and efficient place for storing data. Storing data on the heap is relatively complex; the program needs to keep track of how much space is available on the heap, how much space each piece of data is using, and various other bits of bookkeeping. But the stack is also simple; to make space for some data, just decrement the stack pointer. To tidy up when the data is no longer needed, increment the stack pointer.
This convenience makes the stack a logical place to store the variables that belong to a function. A function has a 256 byte buffer to read some user input? Easy, just subtract 256 from the stack pointer and you've created the buffer. At the end of the function, just add 256 back onto the stack pointer, and the buffer is discarded.
name buffer, followed by a null (zero) byte. The frame pointer and return address are unaltered.There are limitations to this. The stack isn't a good place to store very large objects; the total amount of memory available is usually fixed when a thread is created, and that's typically around 1MB in size. These large objects must be placed on the heap instead. The stack also isn't usable for objects that need to exist for longer than the span of a single function call. Because every stack allocation is undone when a function exits, any objects that exist on the stack can only live as long as a function is running. Objects on the heap, however, have no such restriction; they can hang around forever.
This stack storage isn't just used for the named variables that programmers explicitly create in their programs; it can also be used for storing whatever other values the program may need to store. This is traditionally a particularly acute concern on x86. x86 processors don't have very many registers (there are only 8 integer registers in total, and some of those, like eip and esp, already have special purposes), and so functions can rarely keep all the values they need in registers. To free up space in a register while still ensuring that its current value can be retrieved later, the compiler will push the value of the register onto the stack. The value can then be popped later to put it back into a register. In compiler jargon, this process of saving registers so that they can be re-used is called spilling.
Finally, the stack is often used to pass arguments to functions. The calling function pushes each argument in turn onto the stack; the called function can then pop the arguments off. This isn't the only way of passing arguments—they can be passed in registers too, for example—but it's one of the most flexible.
The set of things that a function has on the stack—its local variables, its spilled registers, and any arguments it's preparing to pass to another function—is called a "stack frame." Because data within the stack frame is used so extensively, it's useful to have a way of quickly referencing it.
The stack pointer can do this, but it's somewhat awkward: the stack pointer always points to the top of the stack, and so it moves around as things are pushed and popped. For example, a variable may start out with an address of at esp + 4. Two more values might be pushed onto the stack, meaning that the variable now has to be accessed at esp + 12. One of those values can then get popped off, so the variable is now at esp + 8.
This isn't an insurmountable difficulty, and compilers can easily handle the challenge. Still, it can make using the stack pointer to access anything other than "the top of the stack" awkward, especially for the hand-coded assembler.
To make things easier, it's common to maintain a second pointer, one that consistently stores the address of the bottom (start) of each stack frame—a value known as the frame pointer—and on x86, there's even a register that's generally used to store this value, ebp. Since this never changes within a given function, this provides a consistent way to access a function's variables: a value that's at ebp - 4 will remain at ebp - 4 for the whole of a function. This isn't just useful for humans; it also makes it easier for debuggers to figure out what's going on.
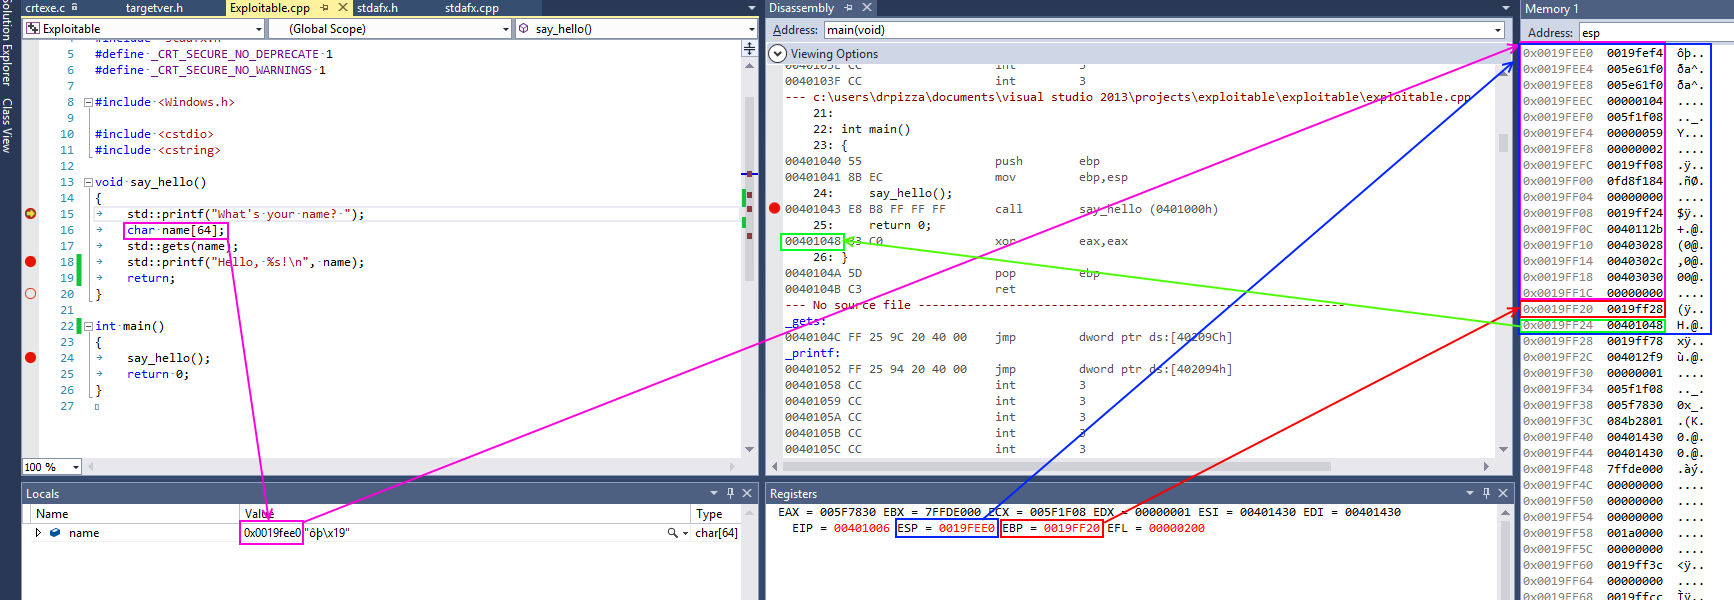
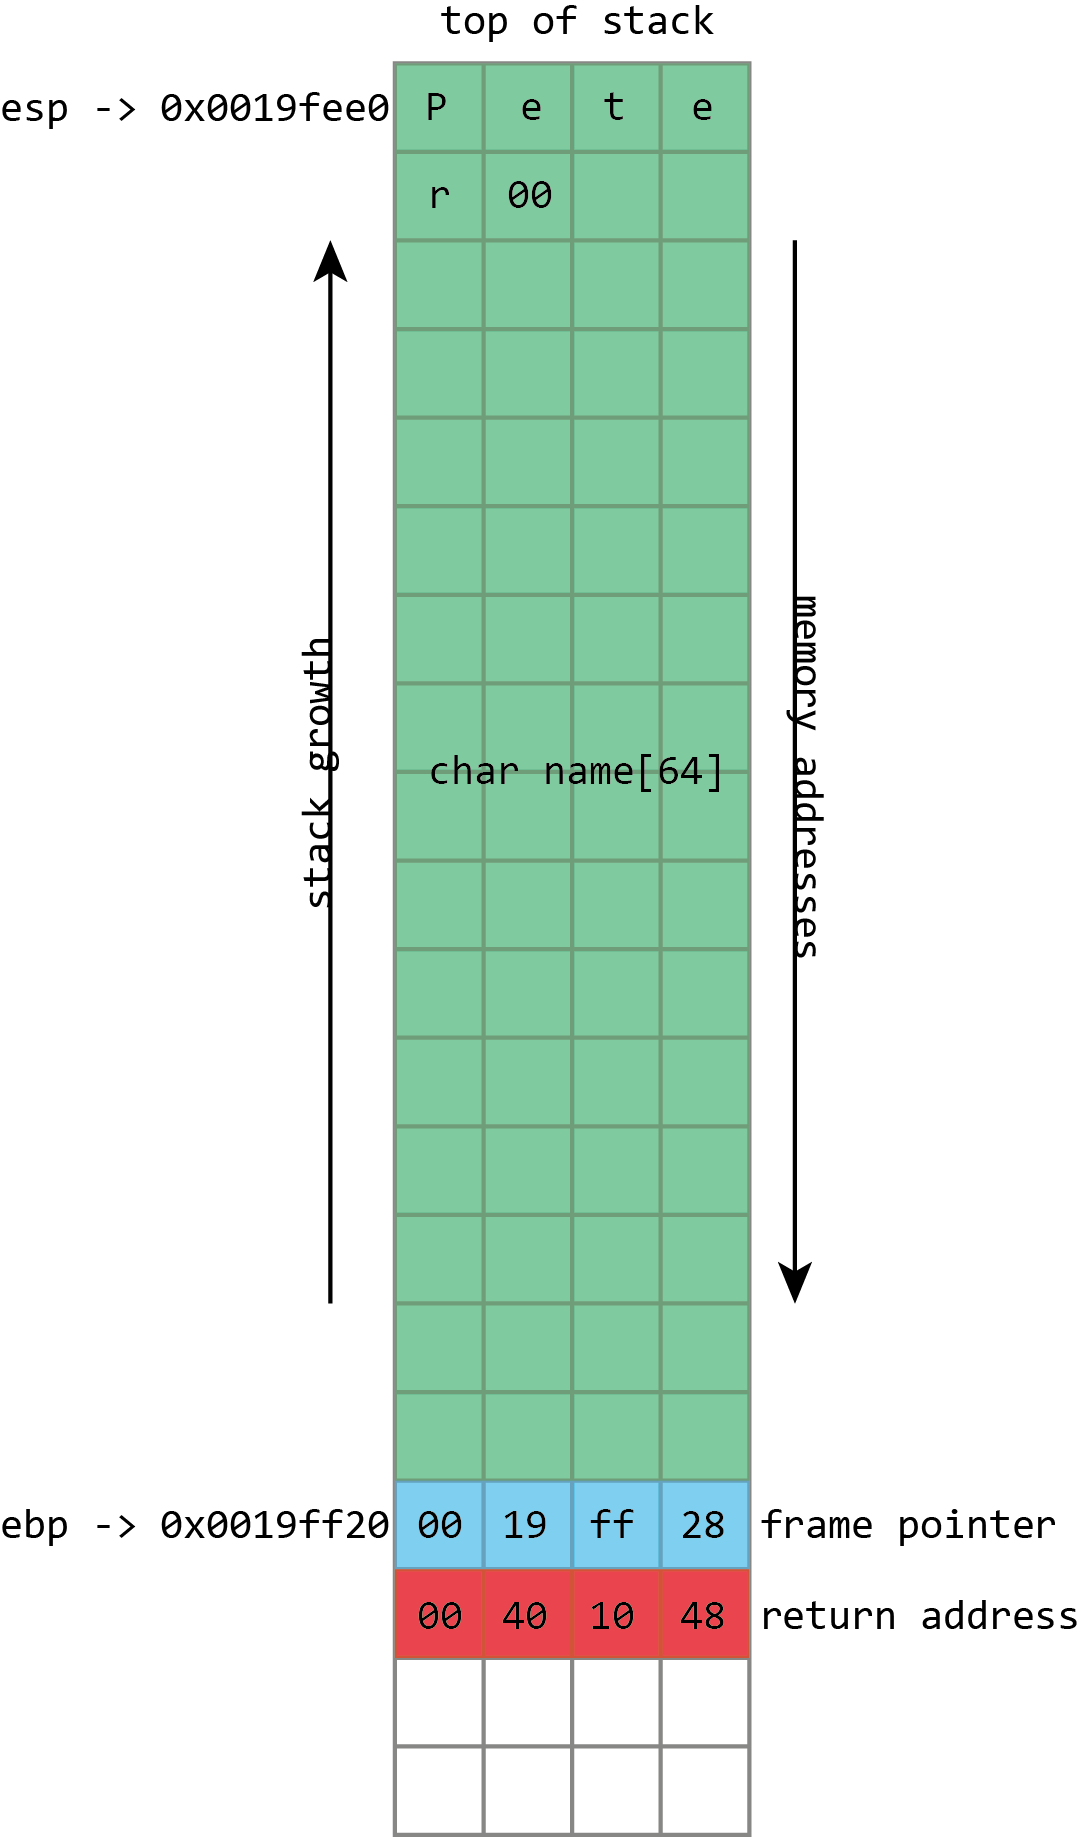
esp contains the address of the top stack, in this case 0x0019fee0, highlighted in blue (on x86, the stack actually grows downwards, toward memory address 0, but it's still called the top of the stack anyway). This function only has one stack variable, name, highlighted in pink. It's a fixed size 32-byte buffer. Because it's the only variable, its address is also 0x0019fee0, the same as the top of the stack.
x86 also has a register called ebp, highlighted in red, that's (normally) dedicated to storing the location of the frame pointer. The frame pointer is placed immediately after the stack variables. Right after the frame pointer is the return address, highlighted in green. The return address references a code fragment with address 0x00401048. This instruction comes immediately after a call instruction, making clear the way the return address is used to resume execution from where the calling function left off.
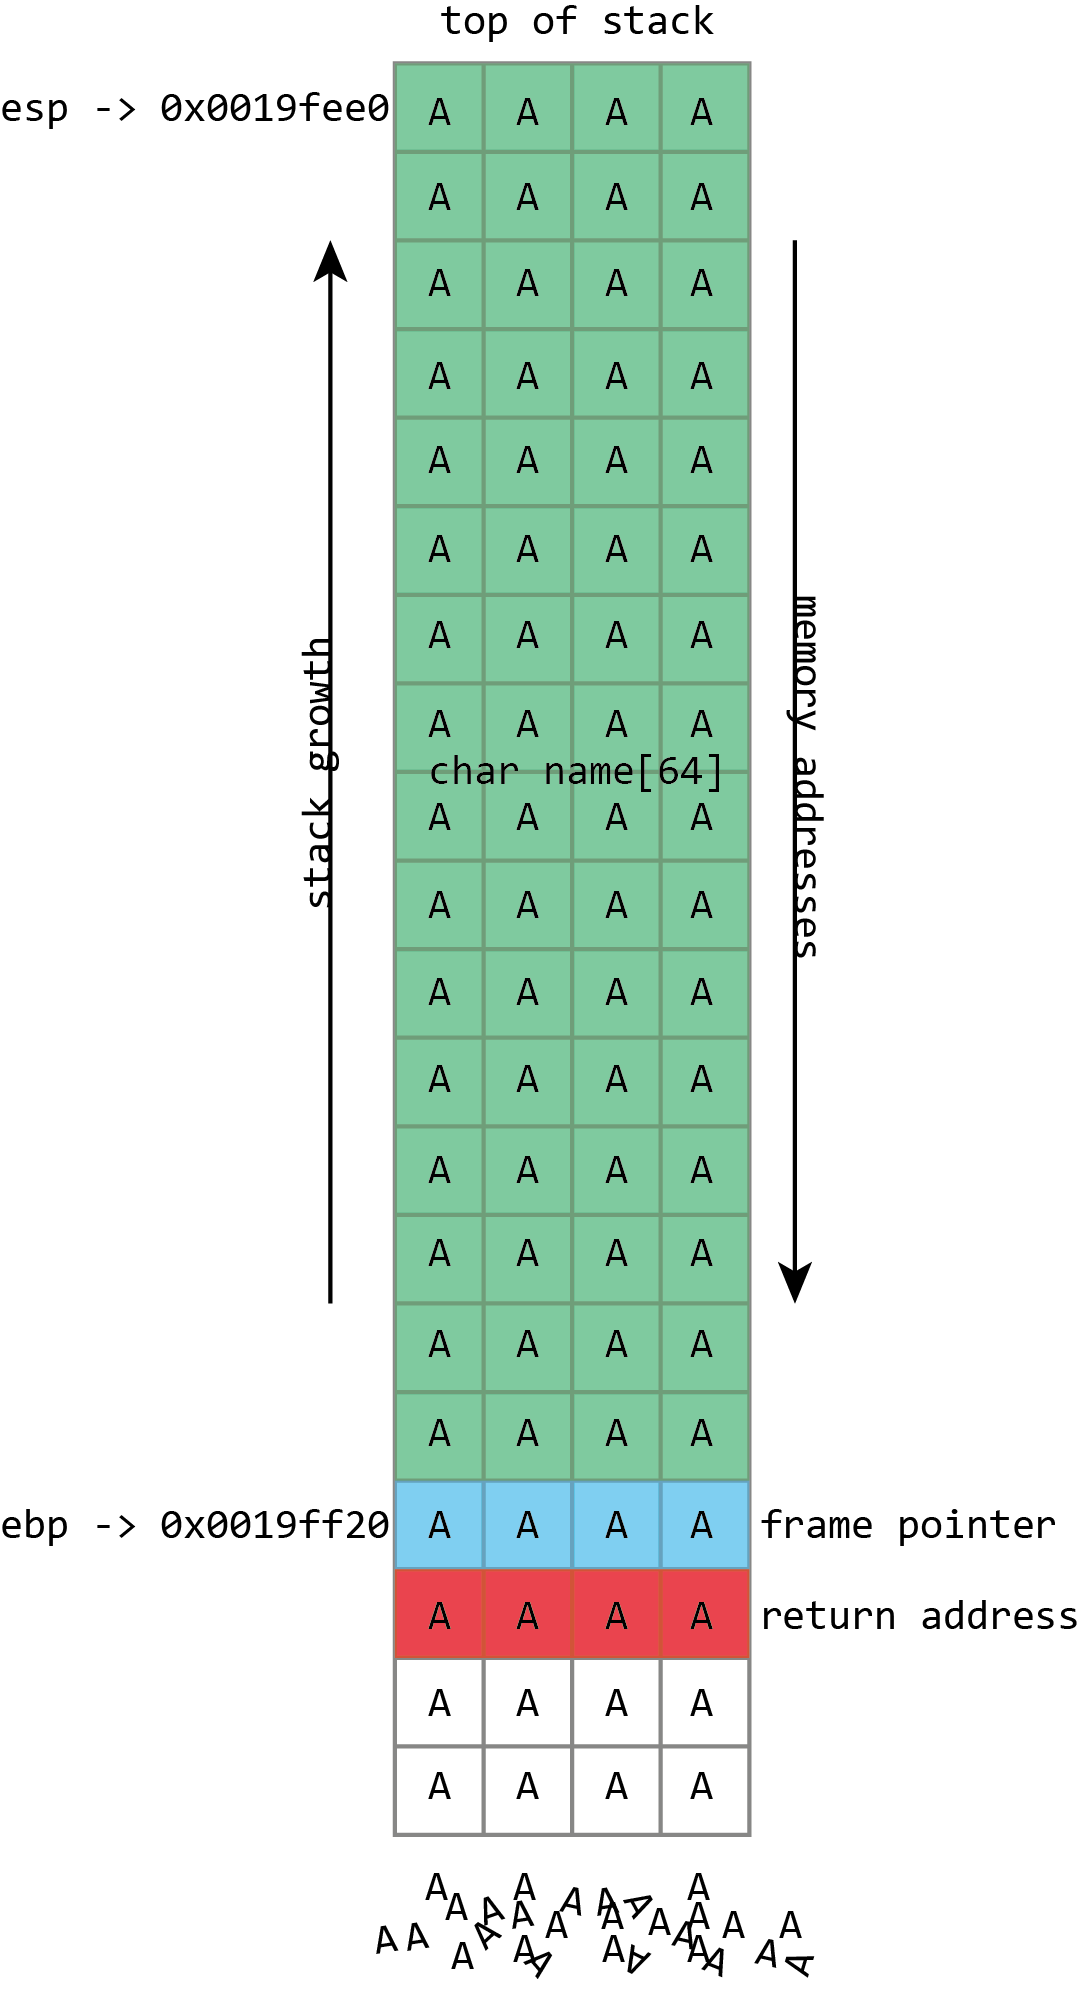
Unfortunately gets() is a really stupid function. If we just hold down A on the keyboard it won't stop once it's filled the name buffer. It'll just keep on writing data to memory, overwriting the frame pointer, the return address, and anything and everything else it can.
name in the above screenshot is the kind of buffer that's regularly overflowed. Its size is fixed at exactly 64 characters. In this case it's filled with a bunch of numbers, and it ends in a final null. As should be clear from the above picture, if more than 64 bytes are written into the name buffer, then other values on the stack will be damaged. If four extra bytes are written, the frame pointer will be destroyed. If eight extra bytes are written, both the frame pointer and the return address get overwritten.
Clearly this will lead to damaging the program's data, but the problem of buffer flows is more serious: they often lead to code execution. This happens because those overflowed buffers won't just overwrite data. They can also overwrite the other important thing kept on the stack—those return addresses. The return address controls which instructions the processor will execute when it's finished with the current function; it's meant to be some location within the calling function, but if it gets overwritten in a buffer overflow, it could point anywhere. If attackers can control the buffer overflow, they can control the return address; if they can control the return address, they can choose what code the processor executes next.
The process probably won't have some nice, convenient "compromise the machine" function for the attacker to run, but that doesn't really matter. The same buffer that was used to overwrite the return address can also be used to hold a short snippet of executable code, called shellcode, that will in turn download a malicious executable, or open up a network connection, or do whatever else the attacker fancies.
Traditionally, this was trivial to do because of a trait that may seem a little surprising: generally, each program would use the same memory addresses each time you ran it, even if you rebooted in between. This means that the location of the buffer on the stack would be the same each time, and so the value used to overwrite the return address could be the same each time. An attacker only had to figure out what the address was once, and the attack would work on any computer running the flawed code.
reader comments
223