How to Install Elastic Stack on Ubuntu 16.04
This tutorial exists for these OS versions
- Ubuntu 20.04 (Focal Fossa)
- Ubuntu 18.04 (Bionic Beaver)
- Ubuntu 16.04 (Xenial Xerus)
On this page
- Step 1 - Install Java
- Step 2 - Install and Configure Elasticsearch
- Step 3 - Install and Configure Kibana with Nginx
- Step 4 - Install and Configure Logstash
- Step 5 - Install and Configure Filebeat on an Ubuntu Client
- Step 6 - Install and Configure Filebeat on a CentOS Client
- Step 8 - Testing
- Reference
Elasticsearch is an open source search engine based on Lucene, developed in java. It provides a distributed and multitenant full-text search engine with an HTTP Dashboard web-interface (Kibana) and JSON documents scheme. Elasticsearch is a scalable search engine that can be used to search for all types of documents, including log file. Elasticsearch is the heart of the 'Elastic Stack' or ELK Stack.
Logstash is an open source tool for managing system events and logs. It provides real-time pipelining to collect data. Logstash will collect the log or data, convert all data into JSON documents, and store them in Elasticsearch.
Kibana is a data visualization interface for Elasticsearch. Kibana provides a pretty dashboard (web interfaces), it allows you to manage and visualize all data from Elasticsearch on your own. It's not just beautiful, but also powerful.
In this tutorial, I will show you how to install and configure Elastic Stack on a single Ubuntu 16.04 server for monitoring server logs and how to install 'Elastic beats' on client PCs with Ubuntu 16.04 and CentOS 7 operating system.
Prerequisite
- Ubuntu 16.04 64 bit server with 4GB of RAM, hostname - elk-master
- Ubuntu 16.04 64 bit client with 1 GB of RAM, hostname - elk-client1
- CentOS 7 64 bit client with 1GB of RAM, hostname - elk-client2
Step 1 - Install Java
Java is required for the Elastic stack deployment. Elasticsearch requires Java 8. It is recommended to use the Oracle JDK 1.8. We will install Java 8 from a PPA repository.
Install the new package 'python-software-properties' so we can add a new repository easily with an apt command.
sudo apt-get update
sudo apt-get install -y python-software-properties software-properties-common apt-transport-https
Add the new Java 8 PPA repository with the 'add-apt-repository' command, then update the repository.
sudo add-apt-repository ppa:webupd8team/java -y
sudo apt-get update
Install Java 8 from the PPA webpub8 repository.
sudo apt-get install -y oracle-java8-installer
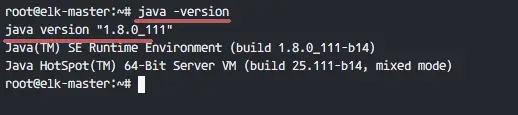
When the installation is finished, make sure Java is installed properly on the system by checking the Java version.
java -version
Step 2 - Install and Configure Elasticsearch
In this step, we will install and configure Elasticsearch. Install Elasticsearch from the elastic repository and configure it to run on the localhost IP.
Before installing Elasticsearch, add the elastic repository key to the server.
wget -qO - https://artifacts.elastic.co/GPG-KEY-elasticsearch | sudo apt-key add -
Add elastic 5.x repository to the 'sources.list.d' directory.
echo "deb https://artifacts.elastic.co/packages/5.x/apt stable main" | sudo tee -a /etc/apt/sources.list.d/elastic-5.x.list
Update the repository and install Elasticsearch 5.1 with the apt command below.
sudo apt-get update
sudo apt-get install -y elasticsearch
Elasticsearch is installed. Now go to the configuration directory and edit the elasticsaerch.yml configuration file.
cd /etc/elasticsearch/
vim elasticsearch.yml
Enable memory lock for Elasticsearch by removing the comment on line 43. We do this to disable swapping memory for Elasticsearchto avoid overloading the server.
bootstrap.memory_lock: true
In the 'Network' block, uncomment the network.host and http.port lines.
network.host: localhost
http.port: 9200
Save the file and exit vim.
Now edit the elasticsearch service file for the memory lock mlockall configuration.
vim /usr/lib/systemd/system/elasticsearch.service
Uncomment LimitMEMLOCK line.
LimitMEMLOCK=infinity
Save the file and exit.
Edit the default configuration for Elasticsearch in the /etc/default directory.
vim /etc/default/elasticsearch
Uncomment line 60 and make sure the value is 'unlimited'.
MAX_LOCKED_MEMORY=unlimited
Save and exit.
The Elasticsearch configuration is finished. Elasticsearch will run under localhost IP address with port 9200 and we disabled swap memory by enabling mlockall on the Ubuntu server.
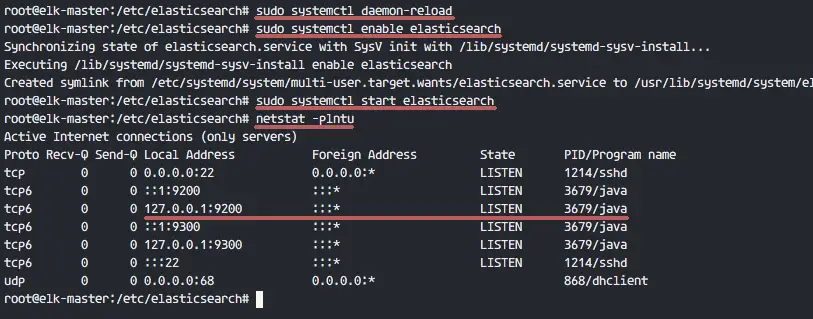
Reload the Elasticsearch service file and enable it to run on the boot time, then start the service.
sudo systemctl daemon-reload
sudo systemctl enable elasticsearch
sudo systemctl start elasticsearch
Wait a sec for Elasticsearch to run, then check the open port on the server, make sure the 'state' for port 9200 is 'LISTEN'.
netstat -plntu
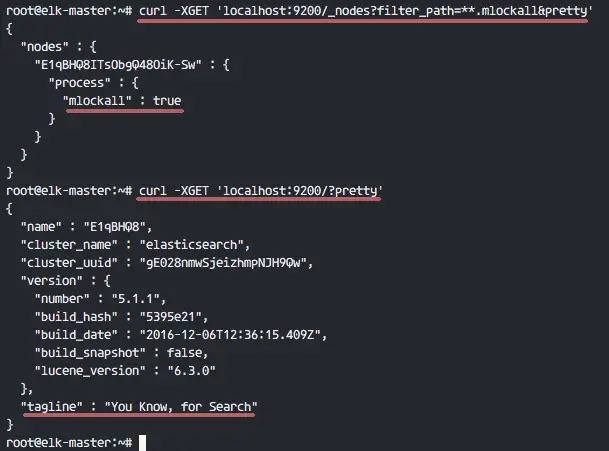
Then check the memory lock to ensure that mlockall is enabled. Also check that Elasticsearch is running with the commands below.
curl -XGET 'localhost:9200/_nodes?filter_path=**.mlockall&pretty'
curl -XGET 'localhost:9200/?pretty'
You will see the results below.
Step 3 - Install and Configure Kibana with Nginx
In this step, we will install and configure Kibana behind a Nginx web server. Kibana will listen on the localhost IP address only and Nginx acts as the reverse proxy for the Kibana application.
Install Kibana with this apt command:
sudo apt-get install -y kibana
Now edit the kibana.yml configuration file.
vim /etc/kibana/kibana.yml
Uncomment the server.port, server.hos and elasticsearch.url lines.
server.port: 5601
server.host: "localhost"
elasticsearch.url: "http://localhost:9200"
Save the file and exit vim.
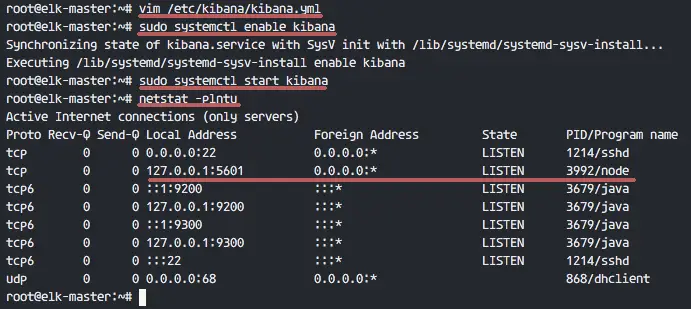
Add Kibana to run at boot and start it.
sudo systemctl enable kibana
sudo systemctl start kibana
Kibana will run on port 5601 as node application.
netstat -plntu
Kibana installation is done, now we need to install Nginx and configure it as a reverse proxy to be able to access Kibana from the public IP address.
Next, install the Nginx and apache2-utils packages.
sudo apt-get install -y nginx apache2-utils
Apache2-utils is a package that contains tools for the webserver that work with Nginx as well, we will use htpasswd basic authentication for Kibana.
Nginx has been installed. Now we need to create a new virtual host configuration file in the Nginx sites-available directory. Create a new file 'kibana' with vim.
cd /etc/nginx/
vim sites-available/kibana
Paste configuration below.
server {
    listen 80;

    server_name elk-stack.co;

    auth_basic "Restricted Access";
    auth_basic_user_file /etc/nginx/.kibana-user;

    location / {
        proxy_pass http://localhost:5601;
        proxy_http_version 1.1;
        proxy_set_header Upgrade $http_upgrade;
        proxy_set_header Connection 'upgrade';
        proxy_set_header Host $host;
        proxy_cache_bypass $http_upgrade;
    }
}
Save the file and exit vim
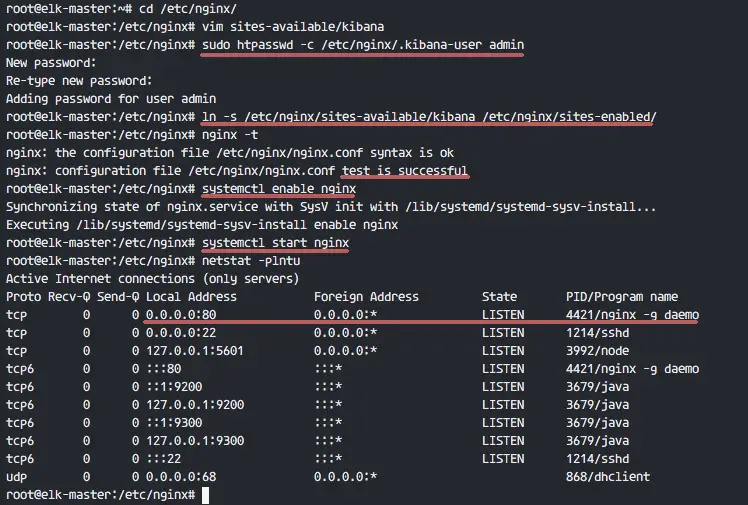
Create a new basic authentication file with the htpasswd command.
sudo htpasswd -c /etc/nginx/.kibana-user admin
TYPE YOUR PASSWORD
Activate the kibana virtual host by creating a symbolic link from the kibana file in 'sites-available' to the 'sites-enabled' directory.
ln -s /etc/nginx/sites-available/kibana /etc/nginx/sites-enabled/
Test the nginx configuration and make sure there is no error, then add nginx to run at boot time and restart nginx.
nginx -t
systemctl enable nginx
systemctl restart nginx
Step 4 - Install and Configure Logstash
In this step, we will install and configure Logsatash to centralize server logs from client sources with filebeat, then filter and transform all data (Syslog) and transport it to the stash (Elasticsearch).
Install Logstash 5 with the apt command below.
sudo apt-get install -y logstash
Edit the hosts file with vim.
vim /etc/hosts
Add the server IP address and hostname.
10.0.15.10 elk-master
Save the hosts file and exit the editor.
Now generate a new SSL certificate file with OpenSSL so the client sources can identify the elastic server.
cd /etc/logstash/
openssl req -subj /CN=elk-master -x509 -days 3650 -batch -nodes -newkey rsa:4096 -keyout logstash.key -out logstash.crt
Change the '/CN' value to the elastic server hostname.
Certificate files will be created in the '/etc/logstash/' directory.
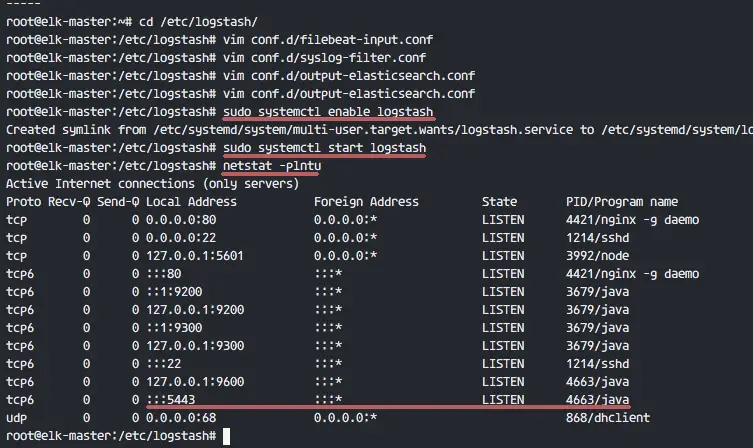
Next, we will create the configuration files for logstash. We will create a configuration file 'filebeat-input.conf' as input file from filebeat, 'syslog-filter.conf' for syslog processing, and then a 'output-elasticsearch.conf' file to define the Elasticsearch output.
Go to the logstash configuration directory and create the new configuration files in the 'conf.d' directory.
cd /etc/logstash/
vim conf.d/filebeat-input.conf
Input configuration, paste configuration below.
input {
  beats {
    port => 5443
    type => syslog
    ssl => true
    ssl_certificate => "/etc/logstash/logstash.crt"
    ssl_key => "/etc/logstash/logstash.key"
  }
}
Save and exit.
Create the syslog-filter.conf file.
vim conf.d/syslog-filter.conf
Paste the configuration below.
filter {
  if [type] == "syslog" {
    grok {
      match => { "message" => "%{SYSLOGTIMESTAMP:syslog_timestamp} %{SYSLOGHOST:syslog_hostname} %{DATA:syslog_program}(?:\[%{POSINT:syslog_pid}\])?: %{GREEDYDATA:syslog_message}" }
      add_field => [ "received_at", "%{@timestamp}" ]
      add_field => [ "received_from", "%{host}" ]
    }
    date {
      match => [ "syslog_timestamp", "MMM  d HH:mm:ss", "MMM dd HH:mm:ss" ]
    }
  }
}
We use a filter plugin named 'grok' to parse the syslog files.
Save and exit.
Create the output configuration file 'output-elasticsearch.conf'.
vim conf.d/output-elasticsearch.conf
Paste the configuration below.
output {
  elasticsearch { hosts => ["localhost:9200"]
    hosts => "localhost:9200"
    manage_template => false
    index => "%{[@metadata][beat]}-%{+YYYY.MM.dd}"
    document_type => "%{[@metadata][type]}"
  }
}
Save and exit.
When this is done, add logstash to start at boot time and start the service.
sudo systemctl enable logstash
sudo systemctl start logstash
Step 5 - Install and Configure Filebeat on an Ubuntu Client
Connect to the server as root with an ssh account.
ssh root@elk-client1
Copy the certificate file to the client with the scp command.
scp root@elk-server:/etc/logstash/logstash.crt .
Edit the hosts file and add the elk-master IP address.
vim /etc/hosts
Add the configuration below at the end of the file.
10.0.15.10 elk-master
Save and exit.
Now we need to add the elastic key to the elk-client1 server.
wget -qO - https://artifacts.elastic.co/GPG-KEY-elasticsearch | sudo apt-key add -
We will use the elastic repository with https download transport, so we need to install the package 'apt-transport-https' to the server.
sudo apt-get install -y apt-transport-https
Add the elastic repository and update all Ubuntu repositories.
echo "deb https://artifacts.elastic.co/packages/5.x/apt stable main" | sudo tee -a /etc/apt/sources.list.d/elastic-5.x.list
sudo apt-get update
Now install 'filebeat' with the apt command.
sudo apt-get install -y filebeat
Next, go to the filebeat configuration directory and edit the file 'filebeat.yml' with vim.
cd /etc/filebeat/
vim filebeat.yml
Add new log files under paths configuration.
  paths:
    - /var/log/auth.log
    - /var/log/syslog
Set the document type to 'syslog'.
document-type: syslog
Disable elasticsearch output by adding comments to the lines.
#-------------------------- Elasticsearch output ------------------------------
#output.elasticsearch:
  # Array of hosts to connect to.
#  hosts: ["localhost:9200"]
Enable logstash output, uncomment the configuration and change the value as below.
output.logstash:
  # The Logstash hosts
  hosts: ["elk-master:5443"]
  bulk_max_size: 2048
  ssl.certificate_authorities: ["/etc/filebeat/logstash.crt"]
  template.name: "filebeat"
  template.path: "filebeat.template.json"
  template.overwrite: false
Save and exit.
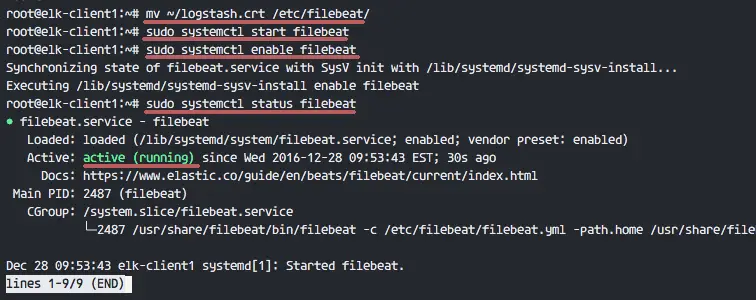
Move the certificate file to the filebeat directory.
mv ~/logstash.crt /etc/filebeat/
Start filebeat and add it to run at boot time.
sudo systemctl start filebeat
sudo systemctl enable filebeat
Check the service status.
sudo systemctl status filebeat
Step 6 - Install and Configure Filebeat on a CentOS Client
Beats are data shippers, lightweight agents that can be installed on the client nodes to send huge amounts of data from the client machine to the Logstash or Elasticsearch server. There are 4 beats available, 'Filebeat' for 'Log Files', 'Metricbeat' for 'Metrics', 'Packetbeat' for 'Network Data' and 'Winlogbeat' for the Windows client 'Event Log'.
In this tutorial, I will show you how to install and configure 'Filebeat' to ship log data to the logstash server over a secure SSL connection.
Copy the certificate file from the elastic server to the client1 server. Login to the client1 server.
ssh root@elk-client2
Copy the certificate file with the scp command.
scp root@elk-master:/etc/logstash/logstash.crt .
TYPE elk-server password
Edit the hosts file and add the elk-master server address.
vim /etc/hosts
Add elk-master server address.
10.0.15.10 elk-master
Save and exit.
Next, import the elastic key to the elk-client2 server.
rpm --import https://artifacts.elastic.co/GPG-KEY-elasticsearch
Add elastic repository to the server.
cd /etc/yum.repos.d/
vim elastic.repo
Paste the configuration below.
[elastic-5.x]
name=Elastic repository for 5.x packages
baseurl=https://artifacts.elastic.co/packages/5.x/yum
gpgcheck=1
gpgkey=https://artifacts.elastic.co/GPG-KEY-elasticsearch
enabled=1
autorefresh=1
type=rpm-md
Save and exit.
Install filebeat with this yum command.
sudo yum -y install filebeat
Filebeat has been installed, now go to the configuration directory and edit the file 'filebeat.yml'.
cd /etc/filebeat/
vim filebeat.yml
On the paths section line 21, add some new log files, we will add two files here: '/var/log/secure' for ssh activity and '/var/log/messages' for the server log.
  paths:
    - /var/log/secure
    - /var/log/messages
Add a new configuration on line 26 to define the file type to 'syslog'.
document-type: syslog
By default, filebeat is using elasticsearch as the output. In this tutorial, we will change it to logshtash. Disable elasticsearch output by adding comments to the lines 83 and 85.
Disable elasticsearch output.
#-------------------------- Elasticsearch output ------------------------------
#output.elasticsearch:
  # Array of hosts to connect to.
#  hosts: ["localhost:9200"]
Now add the new logstash output configuration, uncomment logstash output configuration and change all values to the ones that are shown in the configuration below.
output.logstash:
  # The Logstash hosts
  hosts: ["elk-master:5443"]
  bulk_max_size: 2048
  ssl.certificate_authorities: ["/etc/filebeat/logstash.crt"]
  template.name: "filebeat"
  template.path: "filebeat.template.json"
  template.overwrite: false
Save and exit.
Add filebeat to start at boot time and start it.
sudo systemctl enable filebeat
sudo systemctl start filebeat
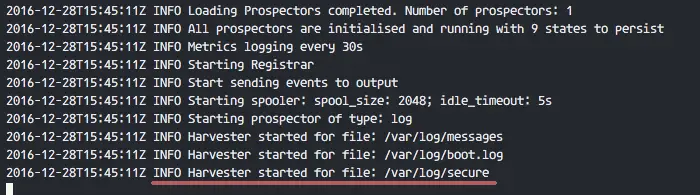
Now you can check and watch the filebeat log file to ensure it is running correctly.
tail -f /var/log/filebeat/filebeat
Step 8 - Testing
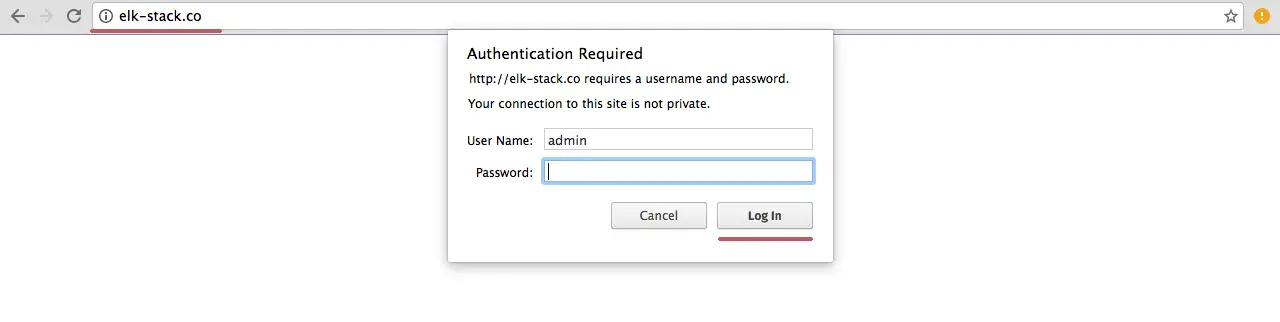
Open your web browser and visit the elastic stack domain that you configured in the nginx configuration, mine is 'elk-stack.co', type in the admin user name with your password and press Enter to log into the Kibana dashboard.
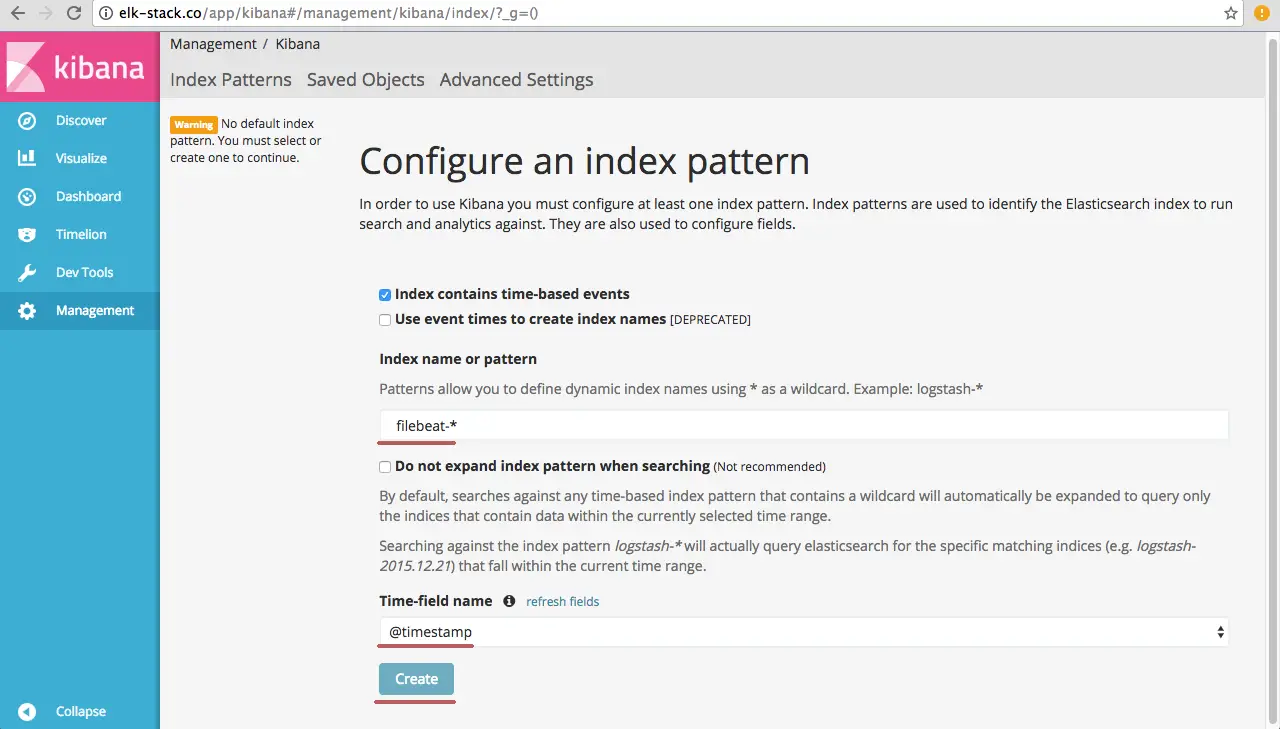
Create a new default index 'filebeat-*' and click on 'Create'.
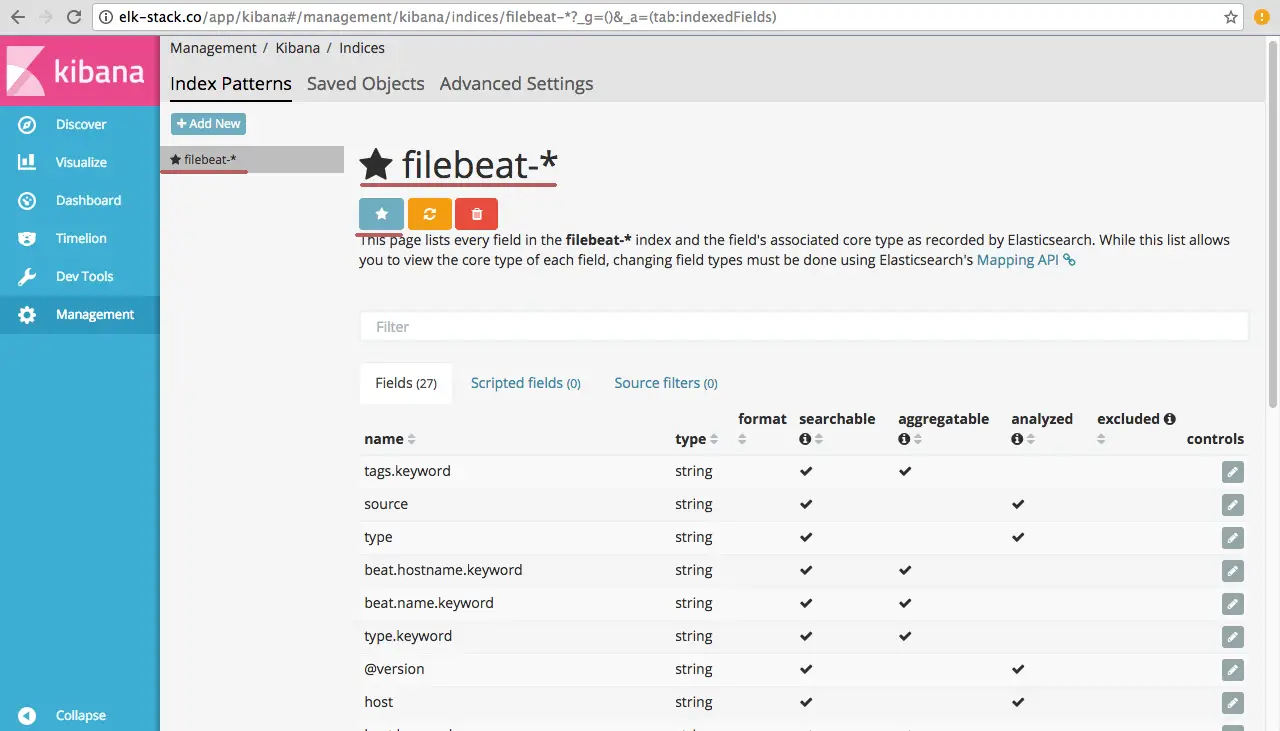
The default index has been created. If you have multiple beats on the elastic stack, you can configure a default beat with just a click on the 'star' button.
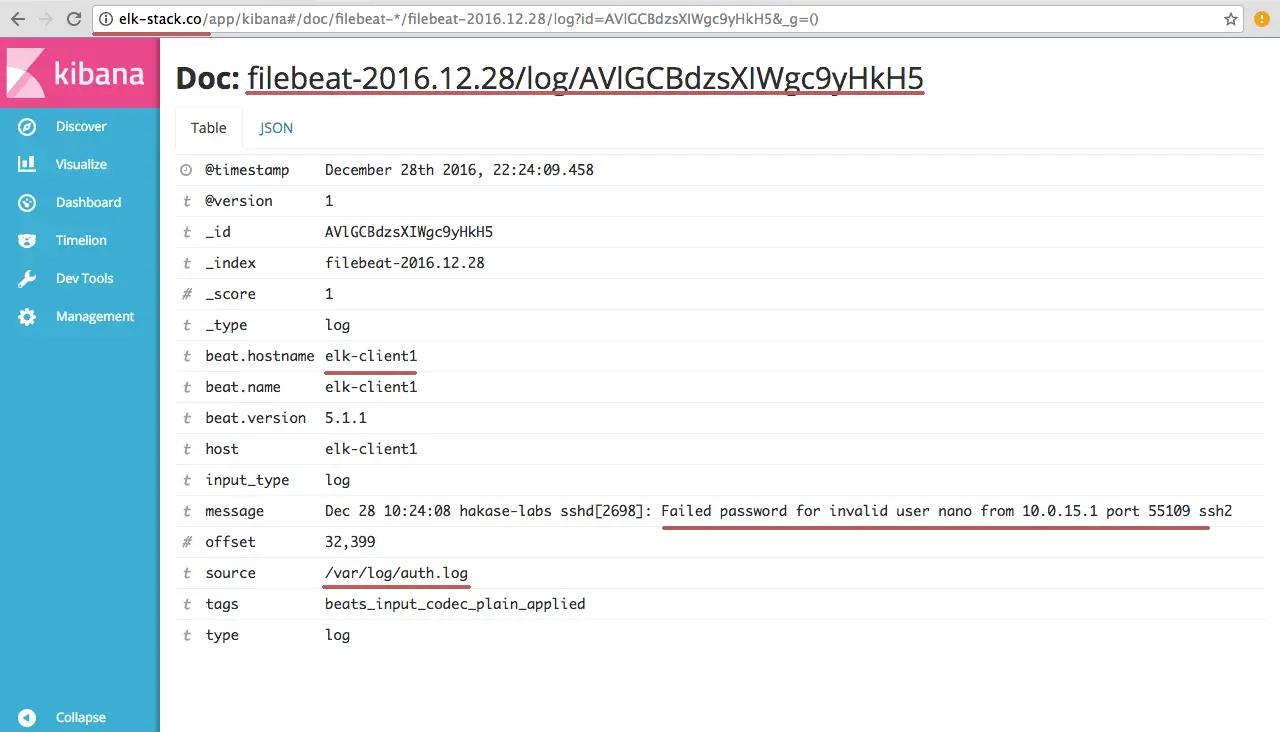
Go to 'Discover' and you will see all the log files from the elk-client1 and elk-client2 servers.
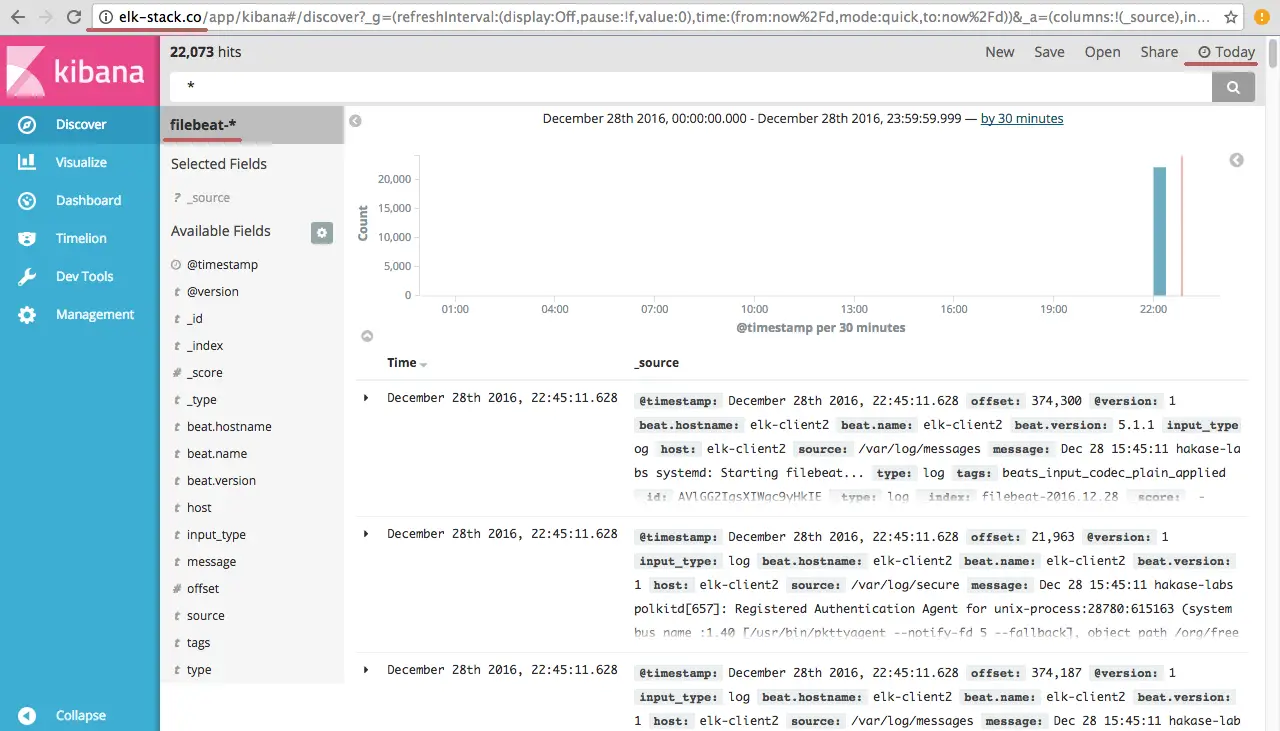
An example of JSON output from the elk-client1 server log for an invalid ssh login.
And there is much more you can do with Kibana dashboard, just try it out!
Elastic Stack has been installed on an Ubuntu 16.04 server, filebeat has been installed on Ubuntu and CentOS client servers.

