How to install and use Volatility memory forensic tool
One of the important parts of Malware analysis is Random Access Memory (RAM) analysis. It helps to identify the running malicious processes, network activities, open connections etc in the compromised system. This article is about the open source security tool "Volatility" for volatile memory analysis. It can be used for both 32/64 bit systems RAM analysis and it supports analysis of Windows, Linux, Mac & Android systems. The Volatility Framework is implemented in Python scripting language and it can be easily used on Linux and Windows operating systems. It is used to analyze crash dumps, raw dumps, VMware & VirtualBox dumps. The extraction techniques are performed completely independent of the system being investigated and give complete visibility into the runtime state of the system.So, this article is about forensic analysis of RAM memory dump using volatility tool. The “malfind” plugin of volatility helps to dump the malicious process and analyzed it. Another plugin of the volatility is “cmdscan” also used to list the last commands on the compromised machine. In this forensic investigation, online resources such “virustotal” and “payload security” website will be used to verify the results. In the end, Windows Defender and Malware Bytes will be used to scan the malicious programs.
Memory Format Support
The following memory format is supported by the latest Volatility release [1].
- Raw/Padded Physical Memory
- Firewire (IEEE 1394)
- Expert Witness (EWF)
- 32- and 64-bit Windows Crash Dump
- 32- and 64-bit Windows Hibernation
- 32- and 64-bit MachO files
- Virtualbox Core Dumps
- VMware Saved State (.vmss) and Snapshot (.vmsn)
- HPAK Format (FastDump)
- QEMU memory dumps
Installation
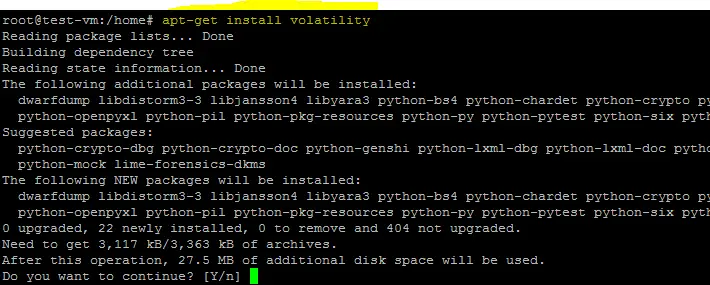
The Volatility tool is available for Windows, Linux and Mac operating system. For Windows and Mac OSes, standalone executables are available and it can be installed on Ubuntu 16.04 LTS using following command.
apt-get install volatility
Memory Analysis
In this tutorial, forensic analysis of raw memory dump will be performed on Windows platform using standalone executable of Volatility tool. It is common in investigation process that the forensic investigator may found several malicious programs on the compromised hard disk. So, memory analysis becomes very important in such events because malicious program or malware may be running on the compromised system.
Integrity Verification
The MD5 hash of the memory dump of the malicious system is given below. It is calculated to verify the acquired image before starting the forensic analysis.
MD5: ee043142485a83f4d49a3a7899408500
Volatility Analysis
The Volatility tool is used to determine that either the PC is infected or not. As we know that, the malicious program can be extracted from the running processes from the memory dump. So, first of all, it is required to identify the supported “profiles” for the dumped memory image. As shown below, the following command is used to identify the “profiles” for the image.
"E:\volatility_2.4.win.standalone\volatility-2.4.standalone.exe" imageinfo -f memdump3.raw
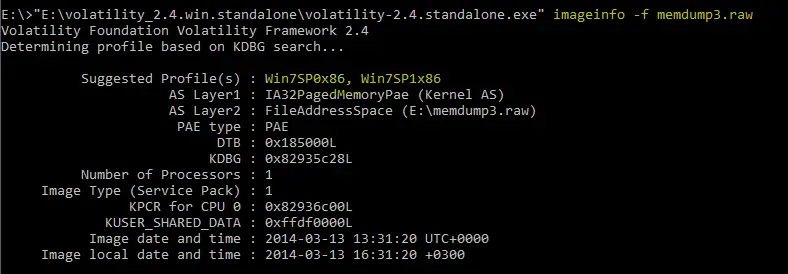
So, the following two profiles are suggested by the “imageinfo” command.
Win7SP0x86 , Win7SP1x86
Now, below mentioned command is used to get a list of running process in the memory dump.
"E:\volatility_2.4.win.standalone\volatility-2.4.standalone.exe" --profile=Win7SP0x86 pslist -f memdump3.raw
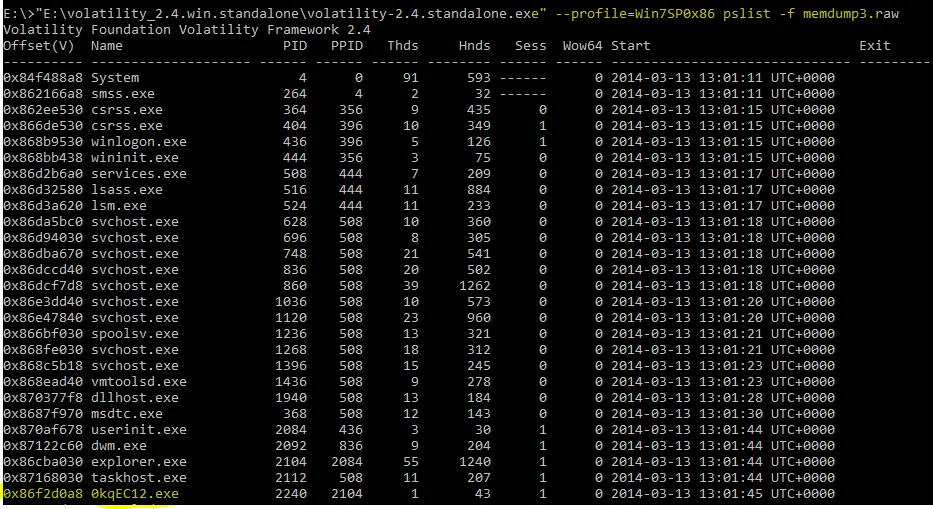
part-1
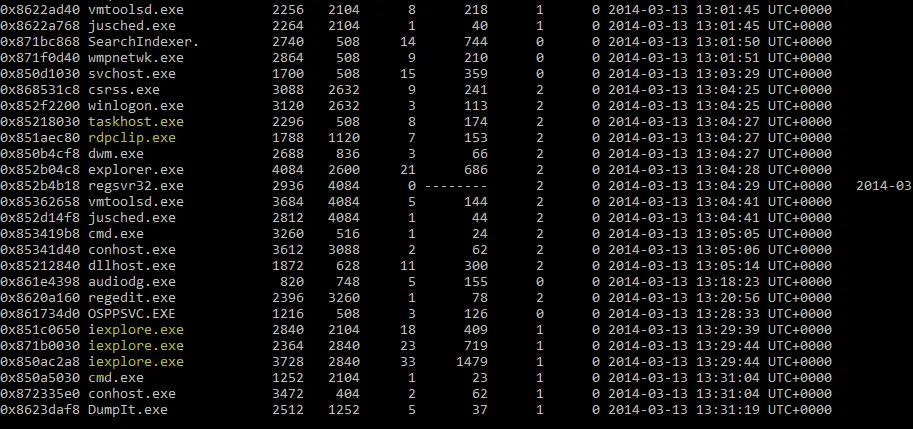
part-2
The “pslist” plugin of volatility tool shows the processes in the memory dump. As shown in the above output, few programs are like “0KqEC12.exe” and “rdpclip.exe” are new on the Windows OS. These may be malicious or new applications for Windows OS. Similarly, multiple “iexplore.exe” programs also seem suspicious.
So, the purpose of the following command is to display the processes in tree (parent/child) format. This will show the linking of the process with the parent process. It will help us to identify the parent process of the malicious program.
"E:\volatility_2.4.win.standalone\volatility-2.4.standalone.exe" --profile=Win7SP0x86 pstree -f memdump3.raw
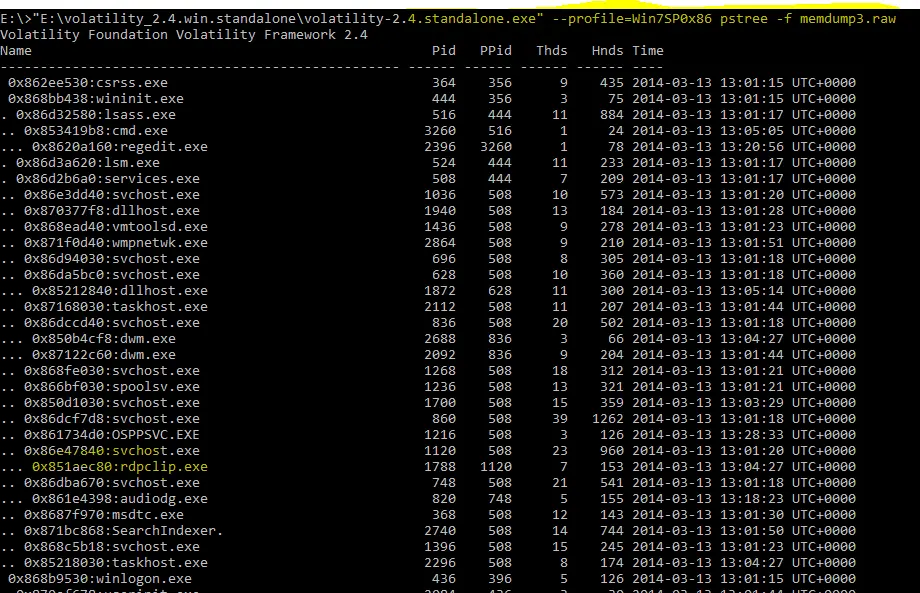
part-1
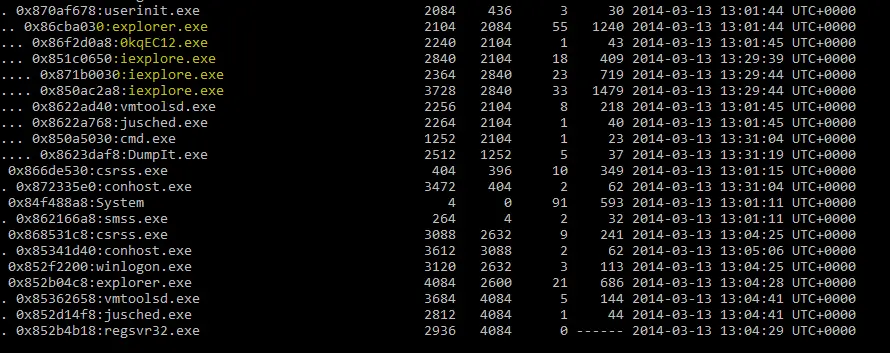
part-2
As shown in the above output of “pstree” plug-in of Volatility tool, processes are shown with their PID and PPID’s. We have highlighted malicious programs for further investigation of victim machine. Now, “malfind” plug-in (which is used to detect malicious DLL's in the process) of Volatility will be used against the highlighted processes.
Process ID: 1120 (svchost.exe)
The following command with malfind switch is used to dump the malicious DLL's in “output” directory.
E:\>"E:\volatility_2.4.win.standalone\volatility-2.4.standalone.exe" --profile=Win7SP0x86 malfind -D E:\output/pid-1120 -p 1120 -f memdump3.raw
As shown below, no dll is found by the malfind plug-in.

Process ID : 1788 (rdpclip.exe)
Again run the same command with PID 1788 to extract the DLL of the process. However, no DLL is found by the plug-in.
E:\>"E:\volatility_2.4.win.standalone\volatility-2.4.standalone.exe" --profile=Win7SP0x86 malfind -D E:\output/pid-1788 -p 1788 -f memdump3.raw

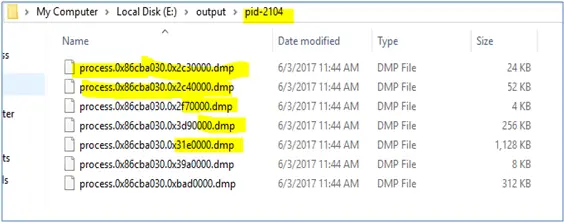
Process ID : 2104 (explorer.exe)
As shown below, following command is run with PID “2104” and malfind extracted the DLL's from the process.
E:\>"E:\volatility_2.4.win.standalone\volatility-2.4.standalone.exe" --profile=Win7SP0x86 malfind -D E:\output/pid-2104 -p 2104 -f memdump3.raw
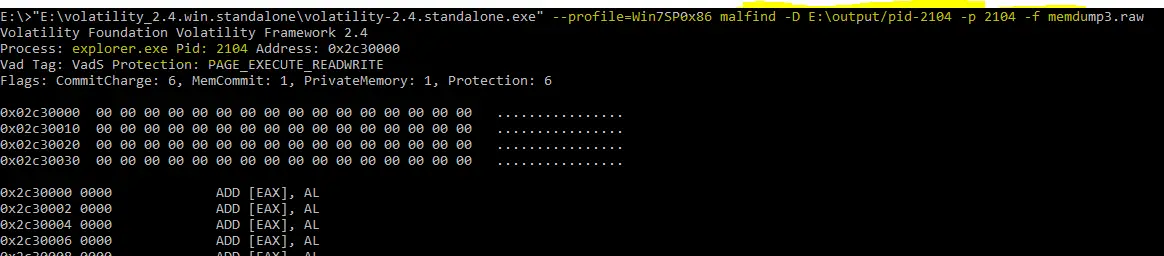
The output of malfind plug-in shows the dump of extracted DLL’s of the malicious process.
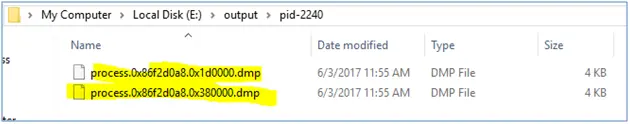
Process ID : 2240(0kqEC12.exe)
The malfind plug-in is running on PID “2240” which seems suspicious for Windows OS.
E:\>"E:\volatility_2.4.win.standalone\volatility-2.4.standalone.exe" --profile=Win7SP0x86 malfind -D E:\output/pid-2240 -p 2240 -f memdump3.raw
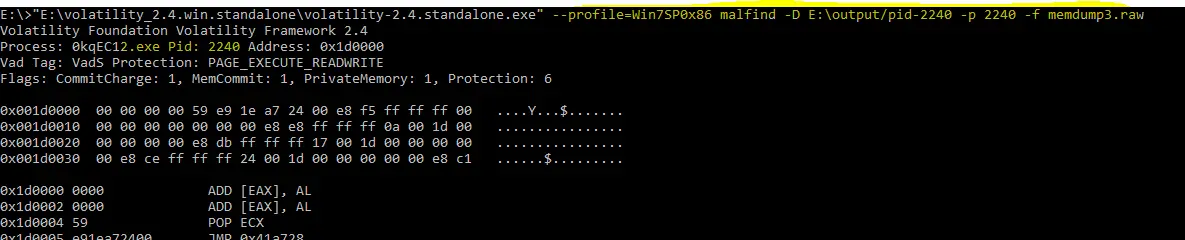
The output of malfind plug-in for PID “2240” is shown below.
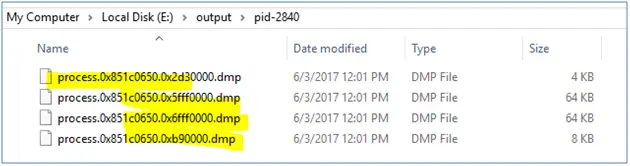
Process ID : 2840 (iexplore.exe)
The output of the Volatility tool against PID “2840” is shown below.
E:\>"E:\volatility_2.4.win.standalone\volatility-2.4.standalone.exe" --profile=Win7SP0x86 malfind -D E:\output/pid-2840 -p 2840 -f memdump3.raw
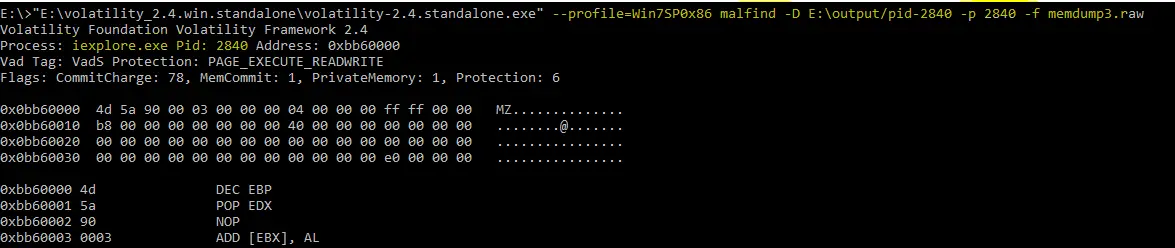
This process also seems as malicious because it is also using the same name like Windows process “iexplorer”.
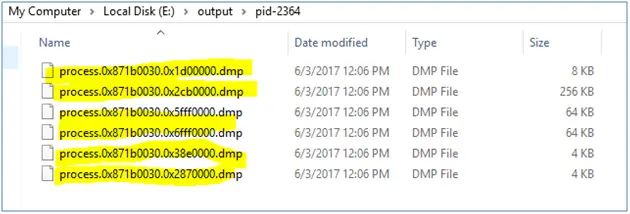
Process ID : 2364(iexplore.exe)
Similarly, malfind run against the malicious program “iexplore” with PID “2364”.
E:\>"E:\volatility_2.4.win.standalone\volatility-2.4.standalone.exe" --profile=Win7SP0x86 malfind -D E:\output/pid-2364 -p 2364 -f memdump3.raw
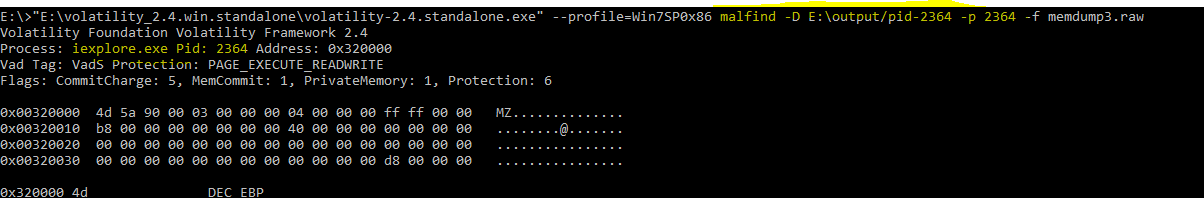
The dump of malfind against PID “2364” is shown below.
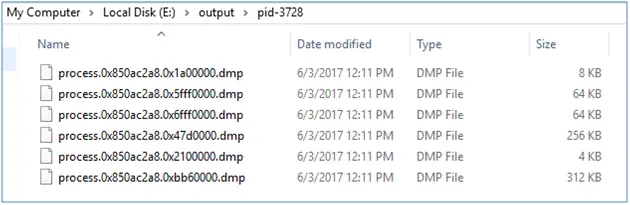
Process ID : 3728 (iexplore.exe)
As shown below, the volatility plug-in for dumping malicious program is run against the PID “3728”
E:\>"E:\volatility_2.4.win.standalone\volatility-2.4.standalone.exe" --profile=Win7SP0x86 malfind -D E:\output/pid-3728 -p 3728 -f memdump3.raw
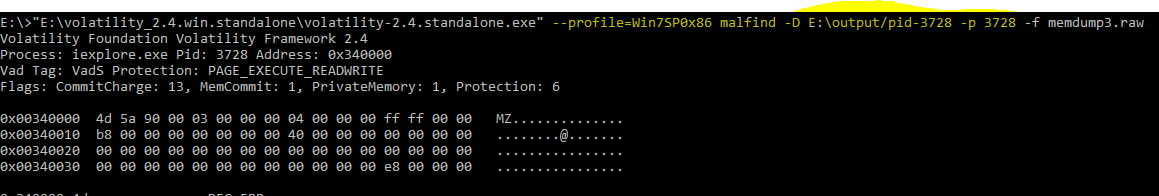
The following snapshot shows the dump of malfind plug-in against PID “3728”.
Scanning Results
The dumps of the malicious programs are scanning using Windows defender and Malware bytes.
Windows Defender
The scanning result of Windows Defender is shown below and it is identified as “Trojan:Win32/EyeStye.N” & “Trojan: Win32/EyeStye.plugin”
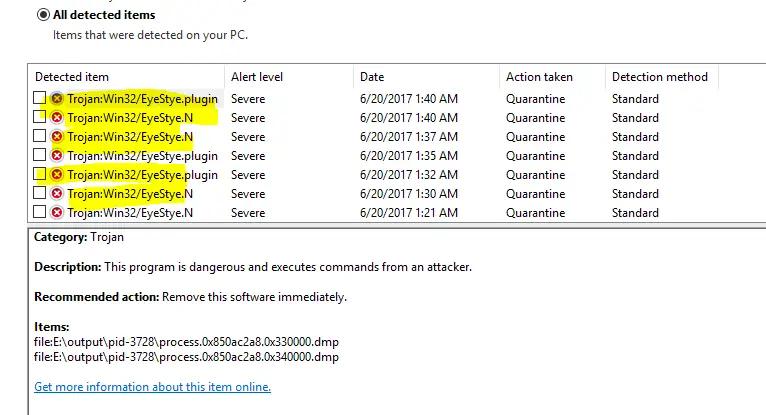
The details of the Trojans are given below.
This Trojan logs keystrokes, monitors Internet activity and steals certain login credentials, then sends the captured data to a remote attacker for financial gain. It may download additional malware, lower web browser security and use a rootkit to hide its malicious activity [2]. The malware utilises code injection in order to hinder detection and removal. When “EyeStye.N” executes, it may inject code into running processes like cmd.exe and explorer.exe.
Our analysis shows that malicious program is injected into the “explorer.exe” program which is the parent of the malicious programs “iexplore.exe”.
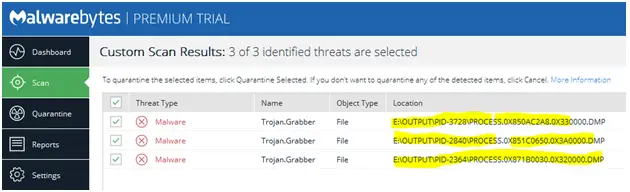
MalwareBytes
The following snapshot shows that MalwareBytes also detected extracted DLL's as malicious and named it as “Trojan.Grabber”.
Command history (CMD history)
Another plug-in of the Volatility tools is “cmdscan” which scan for the history of commands run on the machine. The result of the following command shows the history of commands run on the compromised PC.
E:\>"E:\volatility_2.4.win.standalone\volatility-2.4.standalone.exe" --profile=Win7SP0x86 cmdscan -f memdump3.raw
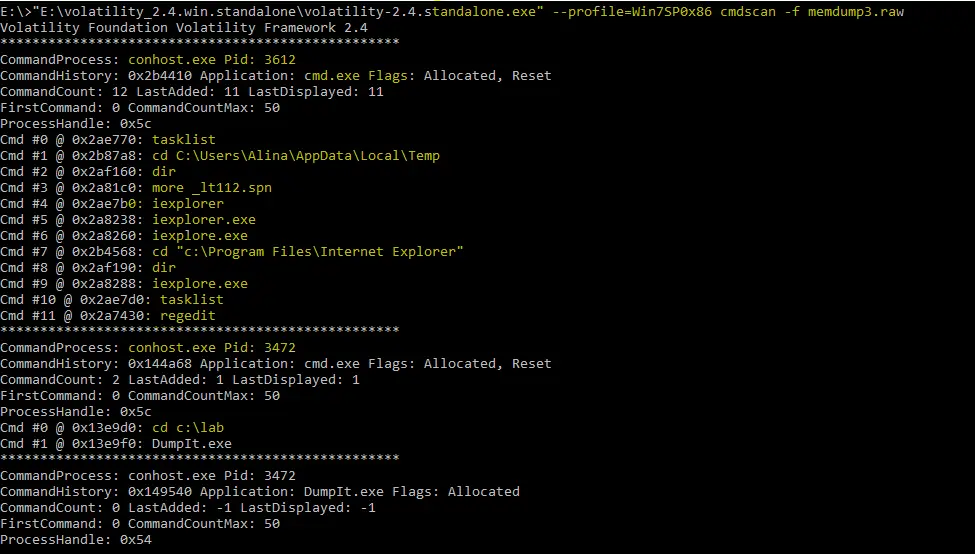
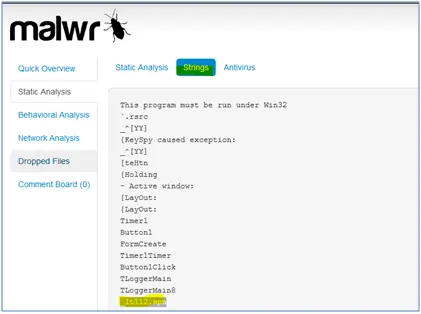
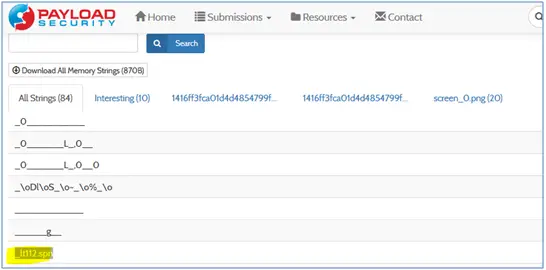
The output of the “cmdscan” shows that attacker run several commands on the command prompt and executed the malicious program “iexplorer.exe” and “ieplore.exe”. Another suspicious shown in the above output is “_lt112.spn”. It is searched on the online resources and the result shows that it is linked with the malware program.
_lt112.spn file
Analyst searched “_lt112.spn” string on the internet and found it on following sites.
Network Connection
As we know that network connection can be found in the memory analysis, so “netscan” plug-in is run against the memory image and the result shows that malicious program “iexplore” opened several connections on the victim machine.
E:\>"E:\volatility_2.4.win.standalone\volatility-2.4.standalone.exe" --profile=Win7SP0x86 netscan -f memdump3.raw
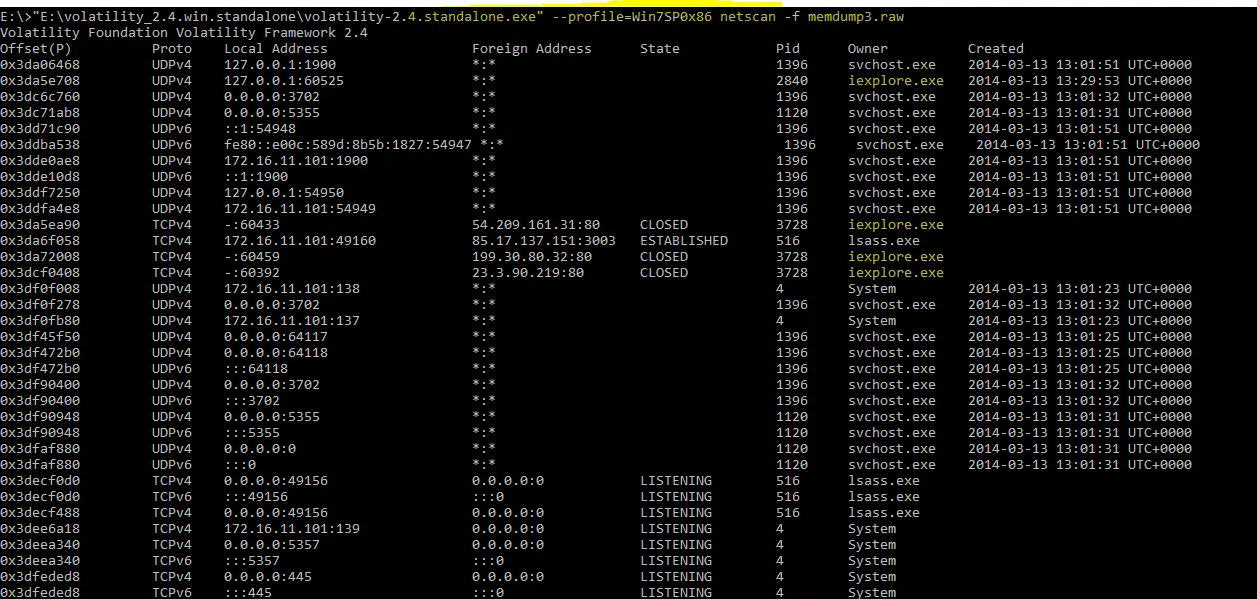
Part-1
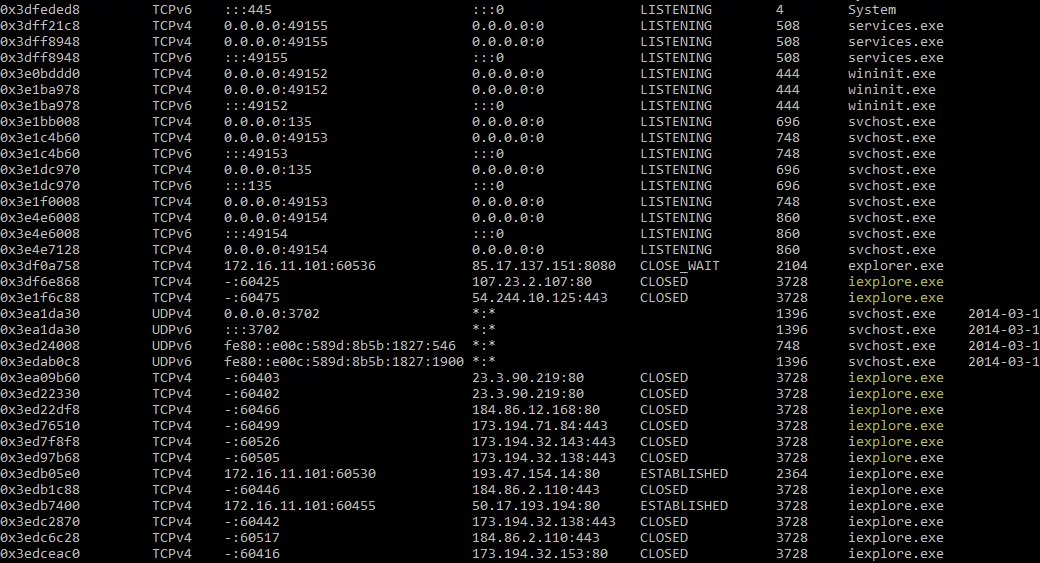
Part-2
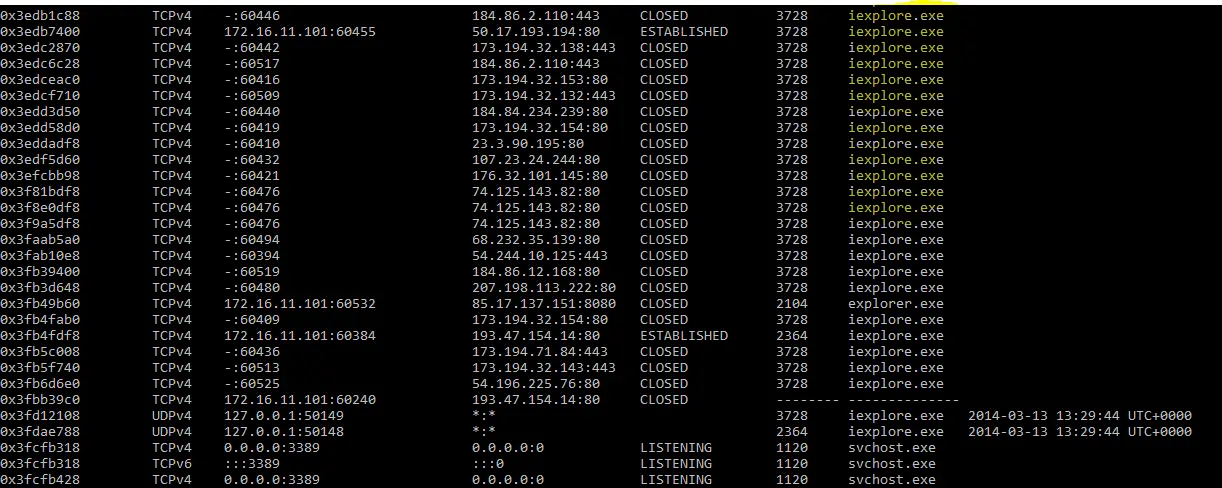
Part-3
So, detailed memory analysis shows that PC is compromised with the malware which is running as “explorer.exe” and “iexplore.exe” on the victim machine. It also shows that malicious program “iexplore.exe” is connecting on port 80 from the victim machine.
References
- http://www.volatilityfoundation.org/24
- https://www.microsoft.com/security/portal/threat/encyclopedia/entry.aspx?Name=Trojan:Win32/EyeStye.N

