How to Install and Configure Monit on Debian 9
Monit is a free and open source process monitoring tool that can be used to monitor system process using the web browser and command line. It is also used for monitoring files, directories and devices for size changes and permission changes. Monit automatically repairs particular process if if goes down. Monit also able to monitor all most services like, Apache, Sendmail, Nginx, FTP, SSH, and MySQL on Linux based system. You can monitor remote hosts TCP/IP port, protocols and ping using Monit. Monit has an ability to stop a specific process that uses high resources. Monit keep watch on your server and send alerts about any critical error conditions and recovery status.
Features
- Automatic start, stop and kill specific process.
- User friendly web interface to status monitoring.
- Notify via email for any critical condition.
- Check system load, CPU usage, RAM usage, Disk, file size changes, permission changes etc.
- Monitor various protocols HTTP, FTP, SSH, POP, IMAP, LDAP, IMAP and SMTM.
- Logging via syslog or own logfile.
In this tutorial, we will explain how to setup and use Monit on Debian 9.
Requirements
- A fresh Debian 9 server installed on your system.
- root password is setup on your server.
1.Update The System
Let's start by updating your system to the latest stable version. You can update it with the following command:
apt-get update -y
apt-get upgrade -y
Once your system is updated, restart your system to make these changes take effect with the following command:
reboot
After restarting, log in with root user and proceed to the next step.
2. Installing Monit
By default, Monit is available in Ubuntu repository. You can easily install it by running the following command:
apt-get install monit -y
Once Monit is installed, start Monit service and enable it to start on boot time by running the following command:
systemctl start monit
systemctl enable monit
You can check the status of Monit service any time by running the following command:
systemctl status monit
3 Configuring Monit
Monit default configuration file monitrc is located at /etc/monit/ directory and other process and server pecific configuration files are located at /etc/monit/conf-available/ diractory. Monit comes with built-in web interface, but is disabled by default. You can enable it by editing /etc/monit/monitrc file as follows:
nano /etc/monit/monitrc
Change the lines from:
# set httpd port 2812 and
# use address localhost # only accept connection from localhost
# allow localhost # allow localhost to connect to the server and
# allow admin:monit # require user 'admin' with password 'monit'
To
set httpd port 2812 and
allow admin:monit # require user 'admin' with password 'monit'
Save and close the file when you are finished, then restart monit service to apply these changes with the following command:
systemctl restart monit
You can check the Monit service status with the following command:
netstat -ant | grep :2812
You should see the following output:
tcp 0 0 0.0.0.0:2812 0.0.0.0:* LISTEN 1615/monit
tcp6 0 0 :::2812 :::* LISTEN 1615/monit
4 Accessing Monit Web Interface
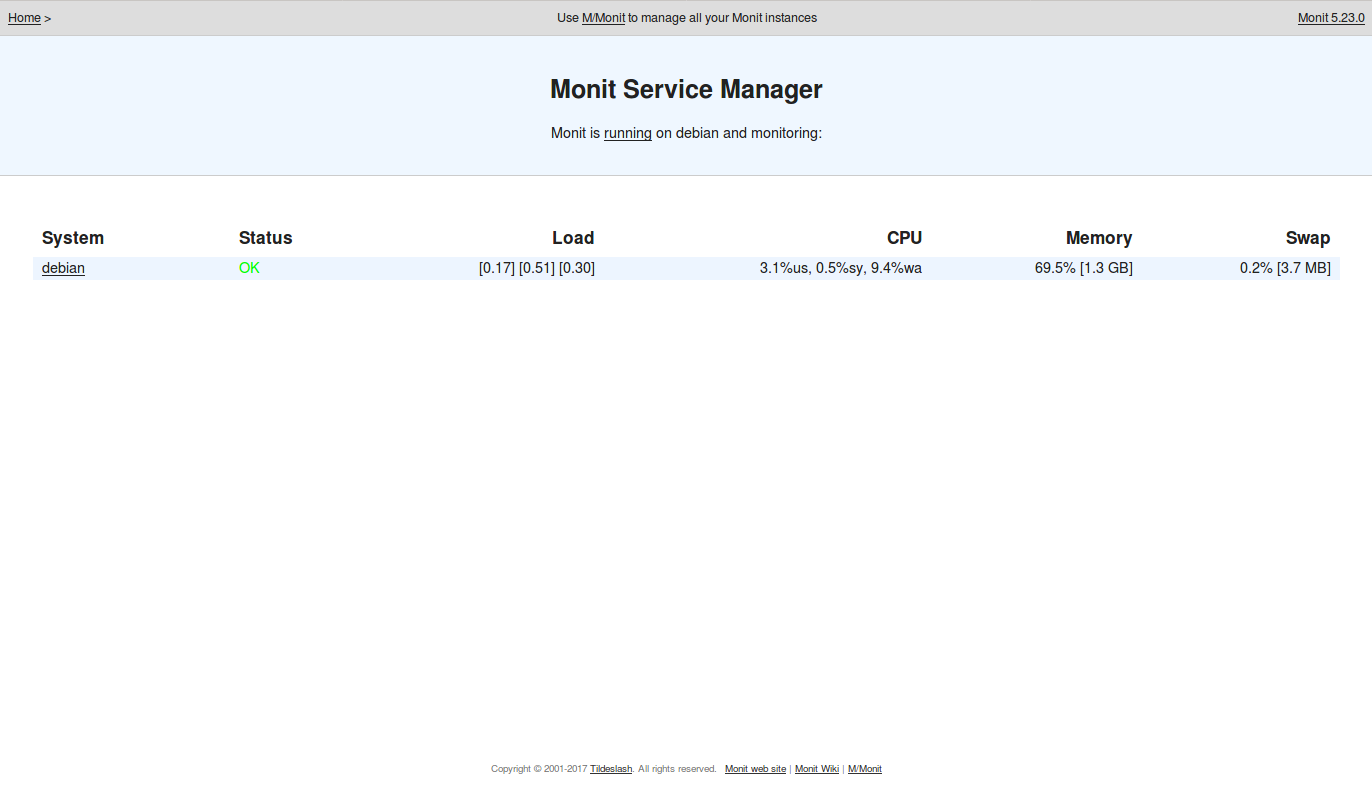
You can access the Monit web interface using the URL http://192.168.0.227:2812, then enter the username admin and password monit. You should see the Monit dashboard as follows:
You can see the status of Minit with the following command:
monit status
You should see the following output:
System 'localhost'
  status                            Running
  monitoring status                 Monitored
  load average                      [0.68] [0.78] [0.45]
  cpu                               0.0%us 0.0%sy 0.0%wa
  memory usage                      294.1 MB [14.7%]
  swap usage                        0 B [0.0%]
  data collected                    Mon, 07 Aug 2017 20:12:36
Once you are done, you can proceed to the next step.
5 Adding Monitoring Services
Once the Monit web interface is configured, you will need to add services that you want to monitor.
Here, we will give some example to monitor some services like, Apache, Proftpd and Rsyslog.
Configure Monit for Apache Service
By default Monit comes with the pre-defined template for some of process and services. You can find these templates in /etc/monit/conf-available/ directory. By default template for Apache is available in Monit. So you will only need to enable it. You can enable it by running the following command:
ln -s /etc/monit/conf-available/apache2 /etc/monit/conf-enabled/
Next, restart monit servcie to apply these changes with the following command:
systemctl restart monit
Configure Monit for Rsyslog Service
First, enable Rsyslog template with the following command:
ln -s /etc/monit/conf-available/rsyslog /etc/monit/conf-enabled/
Next, restart monit service to apply these changes with the following command:
systemctl restart monit
Configure Monit for Proftpd Service
The template for Proftpd is not available with Monit. So you will need to create a config file for Proftpd. You can do this by creating proftpd file inside /etc/monit/conf-available/ directory as follows:
nano /etc/monit/conf-available/proftpd
Add the following lines:
check process proftpd with pidfile /var/run/proftpd.pid
   start program = "/etc/init.d/proftpd start"
   stop  program = "/etc/init.d/proftpd stop"
if failed port 21 protocol ftp then restart
Save and close the file when you are finished, then enable the config file with the following command:
ln -s /etc/monit/conf-available/proftpd /etc/monit/conf-enabled
Next, check the config file for any syntax error with the following command
monit -t
Finally, restart monit service to apply these changes with the following command:
systemctl restart monit
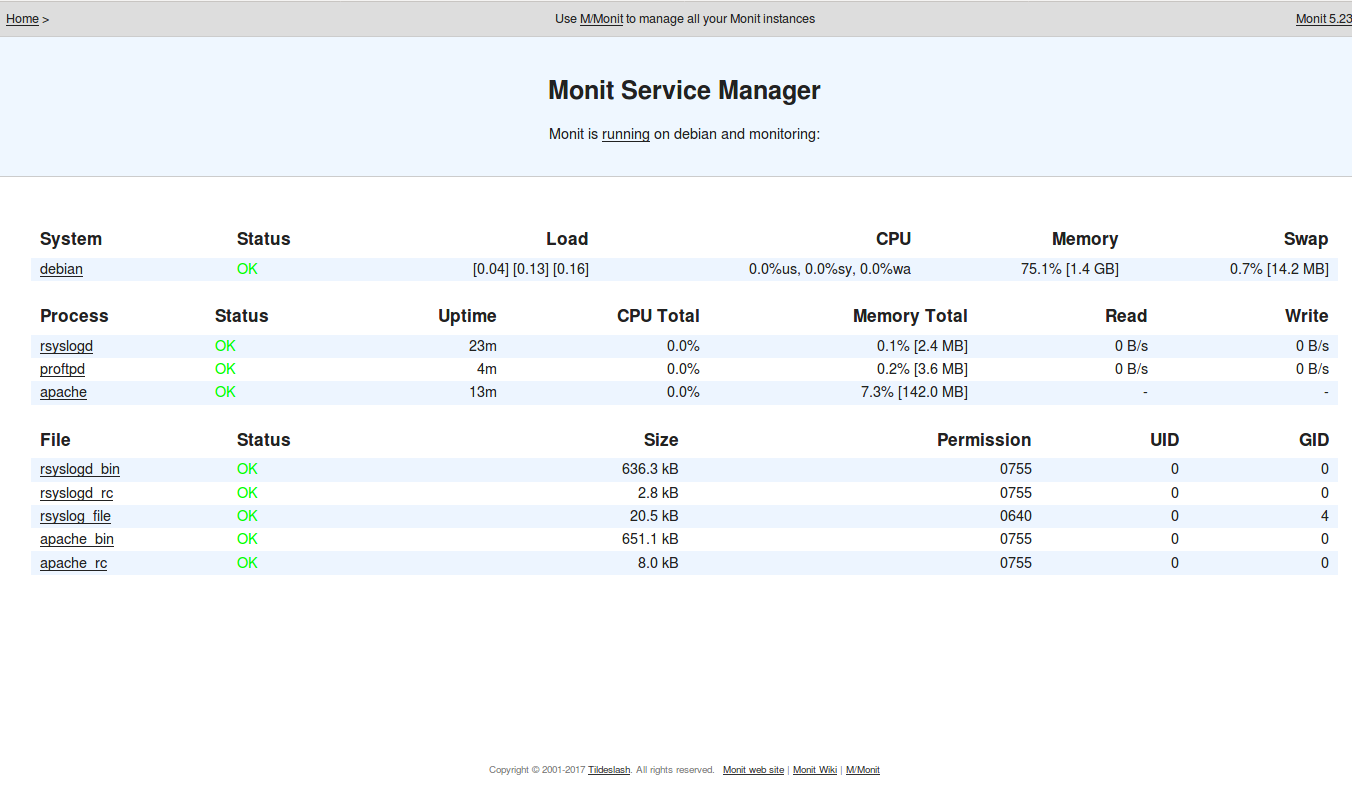
Once you have configured all the required services, access the web interface to monitor all the services as shown below:
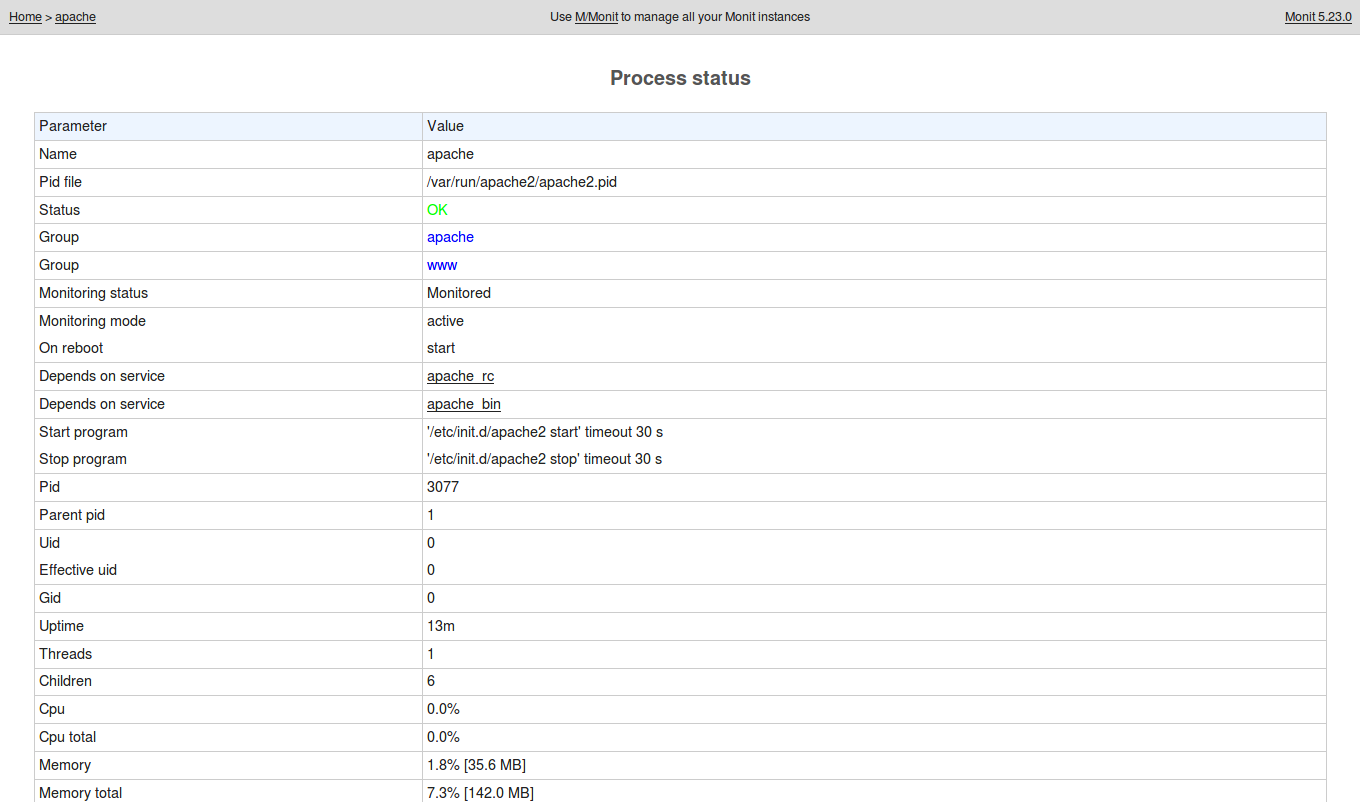
Next, click on the service apache to see the detailed information about apache:
6 Monitoring Monit Through Command Line
You can also monitor Monit from the command line. You can see a quick summary of monit by running the following command:
monit summary
You should see the following output:
The Monit daemon 5.16 uptime: 0m

Process 'rsyslogd'                  Initializing - start pending
File 'rsyslogd_bin'                 Accessible
File 'rsyslogd_rc'                  Accessible
File 'rsyslog_file'                 Does not exist
Process 'proftpd'                   Running
Process 'apache'                    Execution failed
File 'apache_bin'                   Accessible
File 'apache_rc'                    Accessible
System 'localhost'                  Running
You can also see the status of all the services with the following command:
monit status
You should see the following output:
The Monit daemon 5.16 uptime: 0m

Process 'rsyslogd'
  status                            Initializing - start pending
  monitoring status                 Initializing
  data collected                    Mon, 07 Aug 2017 20:41:18

File 'rsyslogd_bin'
  status                            Accessible
  monitoring status                 Monitored
  permission                        755
  uid                               0
  gid                               0
  size                              585.3 kB
  timestamp                         Tue, 25 Oct 2016 11:38:40
  checksum                          d71f3d1c58df065e3aac1e2c566a6436 (MD5)
  data collected                    Mon, 07 Aug 2017 20:41:18

File 'rsyslogd_rc'
  status                            Accessible
  monitoring status                 Monitored
  permission                        755
  uid                               0
  gid                               0
  size                              2.7 kB
  timestamp                         Tue, 25 Oct 2016 11:48:29
  checksum                          a1ef1bb01ba370040d705c92fc09e92e (MD5)
  data collected                    Mon, 07 Aug 2017 20:41:18

File 'rsyslog_file'
  status                            Does not exist
  monitoring status                 Monitored
  data collected                    Mon, 07 Aug 2017 20:41:18

Process 'proftpd'
  status                            Running
  monitoring status                 Monitored
  pid                               4915
  parent pid                        1
  uid                               0
  effective uid                     119
  gid                               65534
  uptime                            3m
  threads                           1
  children                          0
  memory                            3.6 MB
  memory total                      3.6 MB
  memory percent                    0.2%
  memory percent total              0.2%
  cpu percent                       0.0%
  cpu percent total                 0.0%
  port response time                10.737 ms to [localhost]:21 type TCP/IP protocol FTP
  data collected                    Mon, 07 Aug 2017 20:41:18

Process 'apache'
  status                            Execution failed
  monitoring status                 Monitored
  data collected                    Mon, 07 Aug 2017 20:41:48

File 'apache_bin'
  status                            Accessible
  monitoring status                 Monitored
  permission                        755
  uid                               0
  gid                               0
  size                              647.0 kB
  timestamp                         Sat, 29 Jul 2017 22:19:09
  checksum                          ef2a678bdcd791948ceabc3013d9a2c0 (MD5)
  data collected                    Mon, 07 Aug 2017 20:41:18

File 'apache_rc'
  status                            Accessible
  monitoring status                 Monitored
  permission                        755
  uid                               0
  gid                               0
  size                              7.9 kB
  timestamp                         Mon, 07 Aug 2017 20:40:33
  checksum                          744ef9ca584493299c353e2251cbf993 (MD5)
  data collected                    Mon, 07 Aug 2017 20:41:18

System 'localhost'
  status                            Running
  monitoring status                 Monitored
  load average                      [0.96] [0.60] [0.46]
  cpu                               0.0%us 0.0%sy 0.0%wa
  memory usage                      266.4 MB [13.3%]
  swap usage                        2.1 MB [0.4%]
  data collected                    Mon, 07 Aug 2017 20:41:18
To see detailed information about Proftpd service, run the following command:
monit status proftpd
You should see the following output:
The Monit daemon 5.16 uptime: 2m

Process 'proftpd'
  status                            Running
  monitoring status                 Monitored
  pid                               4915
  parent pid                        1
  uid                               0
  effective uid                     119
  gid                               65534
  uptime                            6m
  threads                           1
  children                          0
  memory                            3.6 MB
  memory total                      3.6 MB
  memory percent                    0.2%
  memory percent total              0.2%
  cpu percent                       0.0%
  cpu percent total                 0.0%
  port response time                7.945 ms to [localhost]:21 type TCP/IP protocol FTP
  data collected                    Mon, 07 Aug 2017 20:43:49
Congratulations! you have successfully installed and configured Monit on your Debian 9 server.

