How to use speedtest on a Linux server to check, store and report internet speeds graphically
On this page
- 1 Pre-requisites
- 2 Install speedtest
- 3 Install SQLite3
- 4 Create bandwidth.sh
- 5 Create an SQLite database
- 6 Get a list of servers
- 7 Select server ids and edit bandwidth.sh
- 8 Set up a cronjob
- 9 Set PHP open_basedir
- 10 Create bandwidth.php
- 11 Get a local copy of files
- 12 Enable PHP in ISPConfig
- 13 Load bandwidth.php in browser
- 14 Bar Chart output
- 15 Error handling
- 16 Time zones
- 17 Further steps and ideas
- 18 Links
Following on from a set of problems of poor broadband connectivity I was experiencing I decided that I wanted to monitor the Mbps speed I was getting from my provider on a regular basis. I was seeing especially poor figures when trying to download files in the evening, with much faster speeds achieved very early in the morning.
I have a Linux Debian server sitting in a corner, which is my test and development machine for ISPConfig-hosted websites, as well as some Let's Encrypt code I like to play around with, so I looked for some software that would enable bandwidth testing, runnable from a Linux command line, which could form the basis of an automated shell script system to produce the raw data I needed. I wanted to store the data in a SQL database to make querying simple (I could then easily gather more data and just extract a smaller subset for time periods I was interested in) and to have a web front-end that could produce a simple chart to visualize the data and help highlight the connectivity issues.
The first result of my search was the really useful article by Antonio Valencia at: https://www.howtoforge.com/tutorial/check-internet-speed-with-speedtest-cli-on-ubuntu/
Having followed the instructions there to install speedtest, a quick play showed that I could use it to run tests against a wide set of internet servers and also produce output in CSV format, which is quite suitable for being imported directly in to a SQL table with the minimum amount of effort in software development.
For the relatively small amount of data that would be generated I decided on using SQLite as the back-end store and a quick search of the available open-source javascript based graphing libraries led me to chart.js, which has a simple, clean design with a simple data interface but plenty of ability to tweak advanced options if needed. Converting SQL data to extract just the subset of data I wanted to graph with output via JSON via some straight-forwards PHP code was the way to go.
So overall I needed to design a system that looked like this:
A Linux server running speedtest as a cronjob - maybe 1 per hour - with the speedtest output being stored in an SQLite database - all controlled by a bash shell script file. A web front-end, being a mixture of HTML, CSS, javascript, and PHP to extract data from SQLite and produce a bar chart showing the achieved Mbps figures for the preceding 24 hours (or any other period that I might decide on).
A little experimenting with running speedtest a dozen or so times interactively showed me that there were a few servers available that seemed to give results that were closely in line with the sort of speeds I was experiencing. I considered it a good idea to test against more than one server to get a better grasp of how my Mbps figures were affected by the location of the target server and time of day in a different timezone.
If you want to follow along and set up a similar system for yourself then you will need to select one, or more, servers from the hundreds available for speedtest to use that suit your location.
1 Pre-requisites
- a linux server - I am using Debian 9.1 - stretch
- tty access to the server with root login - I use PuTTY from a Windows laptop
- ISPConfig installed and a website configured with a FTP account too - I am using 3.1.6 with apache set as the web server (you could manage with just a web server, with a few minor changes to the following instructions)
- PHP - I am using 7.0 but this should work with most prior versions too
- FTP client - I use Filezilla - and PureFTPd running on the server
- nano - or your favourite visual editor
I'm assuming here that you are comfortable with logging on to a Linux server, how to get around the directories, the layout of where your webserver expects files to be and how to FTP files to those directories.
Here are the detailed steps to allow you to set all of this up.
2 Install speedtest
Logon to your linux server as root and run the command:
# pip install speedtest-cli
See https://www.howtoforge.com/tutorial/check-internet-speed-with-speedtest-cli-on-ubuntu/ and https://pypi.python.org/pypi/speedtest-cli for further info if you have any issues.
Note: speedtest and speedtest-cli are identical on my install so I will just reference speedtest in the following.
3 Install SQLite3
# apt-get install sqlite3
Use the equivalent for your distro if apt-get is not for you.
4 Create bandwidth.sh
Enter the following bash script code into a file and save it as /usr/local/etc/bandwidth.sh - we'll edit this a little later to make it specific for you.
#!/bin/bash
# run speedtests against 3 servers and save all output results in CSV file for import to sqlite db
#
# run by cronjob once per hour
#
#
function getCSVString () {
	# if speedtest failed (e.g. it couldn't access a server) we need to create a dummy zero entry for this time slot

	# get a timestamp string in the same format that speedtest generates - and we need UTC time
	local RIGHTNOW=$(date --utc +%Y-%m-%dT%H:%M:%SZ)

	# which server are we testing against?
	if [ $1 = "5443" ]
	then
		echo "5443,Fasthosts Internet,Gloucester,$RIGHTNOW,73.09,0.0,0.0,0.0"
	fi
	if [ $1 = "1234" ]
	then
		echo "1234,Uno,Milton Keynes,$RIGHTNOW,168.27,0.0,0.0,0.0"
	fi
	if [ $1 = "1783" ]
	then
		echo "1783,Comcast,\"San Francisco, CA\",$RIGHTNOW,8420.0,0.0,0.0,0.0"
	fi

# test/debug case only
    if [ $1 = "199999999" ]
    then
        echo "99999,Test,Test,$RIGHTNOW,99.99,0.0,0.0,0.0"
    fi
}

function runTest () {
	# run speedtest against named server with csv output saved in tmp file
	/usr/local/bin/speedtest --csv --server $1 > /usr/local/etc/speedtest.tmp
	if [ $? -gt 0 ]
	then
		# speedtest failed so create a zero entry in place of any error message
		getCSVString $1 > /usr/local/etc/speedtest.tmp
	fi

	# save output ready for next server test
	cat /usr/local/etc/speedtest.tmp >> /usr/local/etc/speedtest.csv
}

# main
#######
# run speedtest against 3 servers and save all output results in csv file
cd /usr/local/etc

# clear csv file - needs to be empty at start of run
rm -f /usr/local/etc/speedtest.csv

############################################
# test/debug case - forces speedtest to fail
############################################
# runTest "199999999"
# sleep 5
####### comment out after testing ##########
############################################

runTest "5443"
sleep 10

runTest "1234"
sleep 10

runTest "1783"
sleep 1

# now import the csv data in to sqlite db
sqlite3 -batch /usr/local/etc/bandwidth.db <<"EOF"
.separator ","
.import /usr/local/etc/speedtest.csv bandwidth
EOF

# add current run csv to backup
cat /usr/local/etc/speedtest.csv >> /usr/local/etc/speedtest.bak
I apologize for my "belt and braces" approach of using full paths for files everywhere even when not needed. It's just the way I like to do it. Feel free to improve this if you are comfortable with editing bash scripts.
Set the file properties to make this script executable:
# chmod 0700 bandwidth.sh
5 Create an SQLite database
Create bandwidth.db SQLite database in /usr/local/etc :
#sqlite3 bandwidth.db
and then, at the sqlite> prompt, create a new table with the following command (don't miss the final semi-colon):
sqlite> CREATE TABLE IF NOT EXISTS "bandwidth" ("serverid" INTEGER NOT NULL , "sponsor" VARCHAR NOT NULL , "servername" VARCHAR NOT NULL , "times" DATETIME PRIMARY KEY NOT NULL UNIQUE , "distance" FLOAT NOT NULL , "ping" FLOAT NOT NULL , "download" FLOAT NOT NULL , "upload" FLOAT NOT NULL );
sqlite> .quit
This creates a table called bandwidth with fields that map directly on to the CSV format output of speedtest.
6 Get a list of servers
You will need a list of the servers that speedtest uses.
# speedtest --list > servers.txt
Now check through servers.txt for the numeric ids of the server(s) you want to run your tests against.
# nano servers.txt
The file will look similar to this:
Retrieving speedtest.net configuration...
 5833) Hub Network Services Ltd (Newport, Wales) [57.50 km]
 5938) Spectrum Internet (Cardiff, Great Britain) [65.89 km]
 5443) Fasthosts Internet (Gloucester, Great Britain) [74.31 km]
 6504) Secure Web Services Ltd (Shrewsbury, Great Britain) [78.64 km]
 7265) Unitron Systems & Development Ltd (Telford, Great Britain) [87.11 km]
 8225) Exascale Limited (Wolverhampton, Great Britain) [96.08 km]
 3110) zero.net.uk Ltd (Studley, Great Britain) [96.12 km]
12401) Dragon WiFi LTD (Haverfordwest, United Kingdom) [120.78 km]
 1153) Warwicknet Ltd. (Coventry, Great Britain) [125.18 km]
 1685) Vodafone UK (Newbury, Great Britain) [153.25 km]
 4384) Iomart (Leicester, Great Britain) [157.40 km]
 1234) Uno (Milton Keynes, Great Britain) [170.71 km]
 3504) TNP Ltd. (Manchester, Great Britain) [170.93 km]
11747) Vispa (Manchester, United Kingdom) [170.93 km]
The server ids are on the left-hand side. The figure at the end of each line is the estimate that speedtest has made of the distance, in kilometers, between your location and that of the server, although I am not sure that it is too accurate and it can change from run to run. The test servers will be listed in order of this distance starting with the nearest. Testing against the servers near the top of this list should, in theory, give you the quickest pings and the best download and upload speeds compared to servers lower down the list which are much further away.
7 Select server ids and edit bandwidth.sh
Now would be the time to run speedtest manually against a selection of the different server id's available and see what sort of results you get. I chose a couple of servers close to me in the UK and one in California for comparison. The format of the command to use is:
# speedtest --server 1234
The output you see will be similar to:
Retrieving speedtest.net configuration...
Testing from xxxxxxx (n.n.n.n)...
Retrieving speedtest.net server list...
Selecting best server based on ping...
Hosted by Uno (Milton Keynes) [187.87 km]: 33.243 ms
Testing download speed................................................................................
Download: 1.60 Mbit/s
Testing upload speed...............................................................................................
Upload: 0.55 Mbit/s
Once you have selected the servers you want to use put the numeric server ids (I have used 3 servers but you can vary this if you wish) into the relevant lines in bandwidth.sh
runTest "5443"
sleep 10

runTest "1234"
sleep 10

runTest "1783"
sleep 1
You will also need to adjust the code in the error routine that creates a dummy entry if speedtest should fail on any particular run.
	# which server are we testing against?
	if [ $1 = "5443" ]
	then
		echo "5443,Fasthosts Internet,Gloucester,$RIGHTNOW,73.09,0.0,0.0,0.0"
	fi
	if [ $1 = "1234" ]
	then
		echo "1234,Uno,Milton Keynes,$RIGHTNOW,168.27,0.0,0.0,0.0"
	fi
	if [ $1 = "1783" ]
	then
		echo "1783,Comcast,\"San Francisco, CA\",$RIGHTNOW,8420.0,0.0,0.0,0.0"
	fi
The numbers after $RIGHTNOW in there (e.g. 73.09) are the distances in kilometers from your location to the server in question. I don't use these anywhere so they are just a placeholder and could be any numeric value.
Note with that 1783 example that we have to put quote marks on the location, and escape them in order to get them into the CSV file we are creating. The quotes are required here because this location happens to have a comma within it. Without the escaped quotes the comma would be treated as a CSV field delimiter which would cause a problem with the SQLite import. If the server you select has a similar location text with a comma in it then you will need to use the escaped quotes.
8 Set up a cronjob
Set up a cronjob to run once per hour (or as often as you want within reason) to execute /usr/local/etc/bandwidth.sh. If you are running ISPConfig then you can use it to schedule a cronjob.
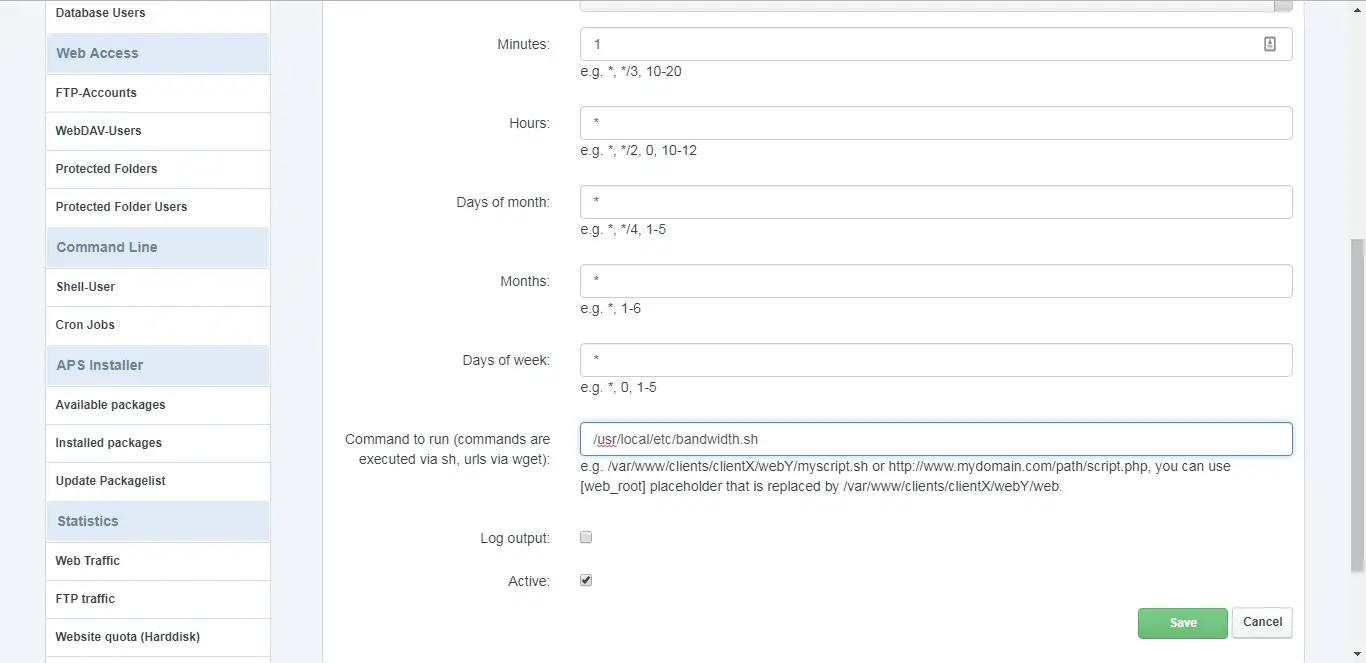
Alternatively at the linux command line you could enter:
# crontab -e
You should see something similar to this (remember you are logged in as 'root'):
* * * * * /usr/local/ispconfig/server/server.sh 2>&1 | while read line; do echo `/bin/date` "$line" >> /var/log/ispconfig/cron.log; done
* * * * * /usr/local/ispconfig/server/cron.sh 2>&1 | while read line; do echo `/bin/date` "$line" >> /var/log/ispconfig/cron.log; done
1 * * * * /usr/local/etc/bandwidth.sh 2>&1
If you aren't running ISPConfig then this may be initially empty. Add that last line exactly as shown above - the spacing is important - to run the shell script starting at 00:01 AM and then to repeat every hour, every day. You can choose different times of course. (The very first time you run this, crontab will ask you which editor you want to use - I select nano.)
9 Set PHP open_basedir
Add /usr/local/etc to the PHP open_basedir entry for the website. In ISPConfig this is found in the Options tab for the Website.
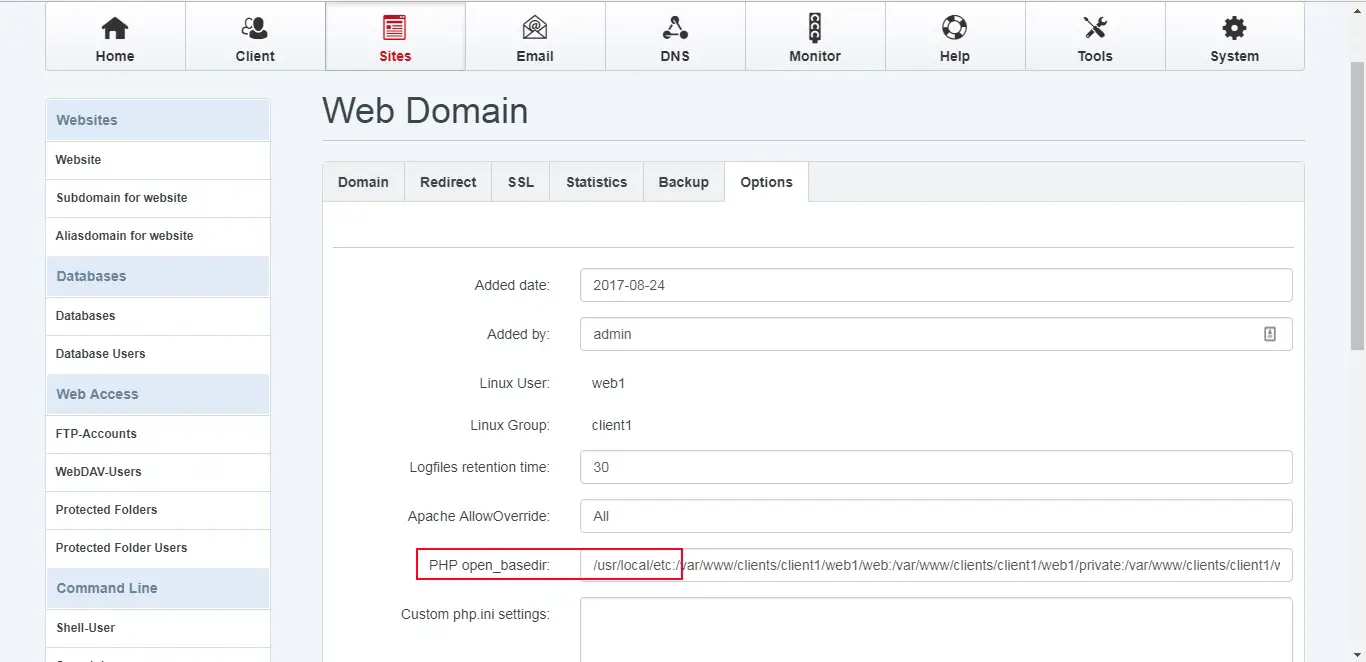
This allows the bandwidth.php code to be able to access the SQLite database, that we have just created, in that directory.
We could have skipped this if we had decided to create the database in a directory that is already set as accessible, such as /var/www/clients/client1/web1/web/, but that would be a poor choice from a security perspective.
10 Create bandwidth.php
You need to copy this code to a file named bandwidth.php on your server in the base web document directory. If you are using ISPConfig this will be something like /var/www/clients/client1/web1/web/
<html lang="en">
<head>
<meta charset="utf-8" />
<title>Bandwidth Monitor - download speeds in last 24 hours</title>
<script src="scripts/Chart.bundle.min.js"></script>
<link href="https://fonts.googleapis.com/css?family=Roboto" rel="stylesheet">
</head>
<body>
<h3 style="font-family: 'Roboto', sans-serif; text-align: center">
Download speeds - last 24 hours
</h3>
<canvas id="myChart" width="1100px" height="500px"></canvas>
<script>
	var bandwidth_data = <?php
	// generate json formatted data from sqlite db
	// Specify sqlite database name and path
	// apache server has setting for PHP open_basedir to include /usr/local/etc
	class MyDB extends SQLite3 {
		function __construct() {
			$this->open('/usr/local/etc/bandwidth.db');
		}
	}
	$db = new MyDB();
	if(!$db) {
		echo $db->lastErrorMsg();
	} else {
		echo "";
	}
	// select the most recent 24 entries to display the last 24 hours of test results (3 servers are tested per hour)
	$sql =<<<EOF
	SELECT serverid, strftime("%H:%M", times) || " " || strftime("%d/%m/%Y", times) AS timestamp, sponsor, servername, download
	FROM bandwidth WHERE serverid = 1234 ORDER BY times LIMIT 24 OFFSET (SELECT COUNT(*)/3 FROM bandwidth)-24;
	EOF;
	$ret = $db->query($sql);
	if(!$ret){
		echo $db->lastErrorMsg();
	} else {
		while($row = $ret->fetchArray(SQLITE3_ASSOC) ) {
			$results[] = $row;
		}
	$ukdata = json_encode($results);
	}
	echo $ukdata;
	$db->close();
	?>
	;
	// extract the fields we want to chart from the JSON data
	var bwlabels = [], bwdata = [];
	var mbps, bvalue;
	for (var i = 0; i < bandwidth_data.length ; i++){
		bwlabels.push(bandwidth_data[i].timestamp);
		// convert bps to Mbps rounded with 3 decimal places in local format
		mbps = Math.round(bandwidth_data[i].download/1000).toFixed(3)/1000;
		bvalue = mbps.toLocaleString(undefined, { minimumFractionDigits: 3 });
		bwdata.push(bvalue);
	}
	var bar_color = 'rgba(0, 128, 255, 0.9)';
	var ctx = document.getElementById("myChart").getContext('2d');
	var myChart = new Chart(ctx, {
		type: 'bar',
		data: {
			labels: bwlabels,
			datasets: [{
				label: 'Mbps download',
				data: bwdata,
				backgroundColor: bar_color,
				borderColor: bar_color,
				borderWidth: 1
			}]
		},
		options: {
			// we override the default tooltip which drops trailing zeros even though we already put them there
			tooltips: {
				callbacks: {
					label: function(tooltipItem, data) {
						var value = data.datasets[0].data[tooltipItem.index];
						var label = 'download: ';
						var retvalue = value.toLocaleString(undefined, { minimumFractionDigits: 3 });
						return label + ' ' + retvalue + ' Mbps';
					}
				}
			},
			responsive: false,
			scales: {
				xAxes: [{
					ticks: {
						autoSkip: false,
						maxTicksLimit: 24
					}
				}],
				yAxes: [{
					ticks: {
						beginAtZero:true
					}
				}]
			}
		}
	});
</script>
</body>
</html>
Edit this file to use the serverid you want to report on. I am using server 1234 in my example here, as I found that, after exploring a few days of data, this server was producing Mbps figures most closely aligned with the speeds I felt I was getting. The serverid is in the WHERE clause of the SQL SELECT statement:
SELECT serverid, strftime("%H:%M", times) || " " || strftime("%d/%m/%Y", times) AS timestamp, sponsor, servername,
download
FROM bandwidth
WHERE serverid = 1234
ORDER BY times
LIMIT 24 OFFSET (SELECT COUNT(*)/3 FROM bandwidth)-24;
What exactly is this SQL statement doing? If you are not familiar with SQL then let's look at each part.
a. SELECT is the command to read records from a SQL database table and is followed by the fields to be read and other options.
b. strftime("%H:%M", times) || " " || strftime("%d/%m/%Y", times) AS timestamp
is to reformat the datetime string that speedtest has created in its CSV output to something a little more user friendly. I want UK formatted dates so this will take a string such as "2017-08-31T12:02:51.898186Z" and turns it into "12:02 31/08/2017". It's simpler to do this reformatting directly in the SQL statement rather than have to process it afterwards. The times here are going to be UTC/GMT which is OK for me, but you may want to change this; e.g. if you want US formatted dates then change that second part to strftime("%m/%d/%Y", times).
c. serverid, timestamp, sponsor, servername, download are the fields we want to read from the SQL table and create in our JSON object.
d. FROM bandwidth is the name of the SQL table we are reading from.
e. WHERE serverid = 1234 sets the subset of the table to be read - change this to match the serverid you have used, and you may want to read data for more than one server - but that will complicate the chart.
f. ORDER BY times sets the sort order of the output - we want it ordered by the timestamp that speedtest set for each run.
g. LIMIT 24 restricts the output to 24 records, as we only want to show 24 hours worth of data and because our cronjob is set to run once per hour. If you were running twice an hour then you would need to set this to 48 to get 24 hours of data.
h. OFFSET (SELECT COUNT(*)/3 FROM bandwidth)-24; we want the last 24 records from the table as they are the most recent entries which we are interested in so we have to specify an OFFSET to match up with the LIMIT. Without this we would always be getting the first 24 records in the table rather than the 24 most recent ones. To get the right offset we count all the records in the table with (SELECT COUNT(*)) then divide this by 3 (as we are running speedtest 3 times per hour, once for each of the 3 different servers) and then subtract 24 from this total to get the right OFFSET position so that LIMIT 24 will then get the records we want.
If you have changed the bash script to run something other than 3 different server tests per hour then adjust that /3 part accordingly. If you are only testing against one server then the division is not needed at all.
You may also want to adjust the overall size of the chart, where I have taken the easy route of hard coding a size suitable for my screen - it is set in this line:
<canvas id="myChart" width="1100px" height="500px"></canvas>
11 Get a local copy of files
I prefer to have local versions of any css and js library files (but not Google fonts) that are needed in a web page and if you are the same then you will need to get a copy on your server of Chart.bundle.min.js and place it in the /var/www/clients/client1/web1/web/scripts directory on your server (or whichever base directory is right for you).
You can download the file from: https://cdnjs.cloudflare.com/ajax/libs/Chartajs/2.6.0/Chart.bundle.min.js
If you don't want to use a local copy then edit bandwidth.php to point to the public CDN version instead. Just change this line:
<script src="scripts/Chart.bundle.min.js"></script>
to this:
<script src="https://cdnjs.cloudflare.com/ajax/libs/Chartajs/2.6.0/Chart.bundle.min.js"></script>
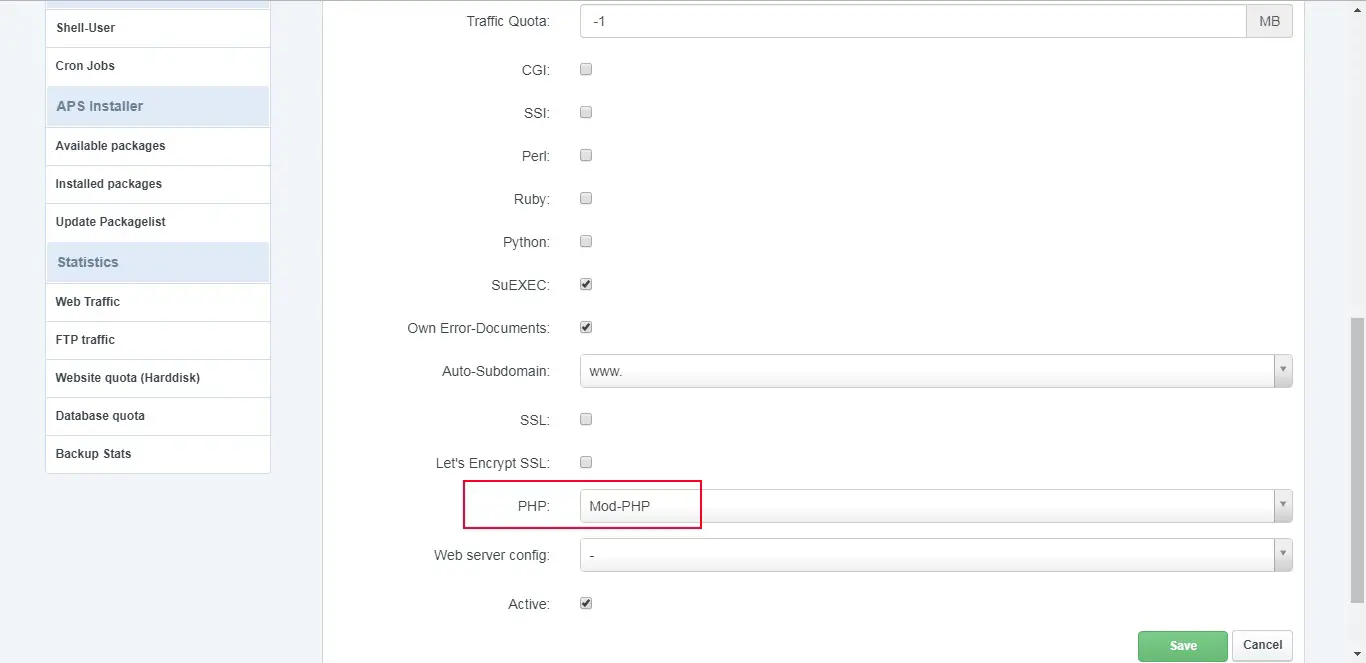
12 Enable PHP in ISPConfig
Don't forget to enable PHP on your Website settings, if this has not already been set.
13 Load bandwidth.php in browser
We're finally finished. Once the bandwidth.sh shell script has had time to run a few times to generate some data (or you could run it manually several times at first) point your browser at your Linux server website, load bandwidth.php and you should see something like this:

And yes, my broadband really is that bad!
Finally, here are a few extra points worth covering:
14 Bar Chart output
We should note that the download and upload figures stored in the SQL table are in bps rather than Mbps (along with a bewildering number of decimal digits - numbers like 1533681.5922415722). This is just the way speedtest produces the data when run in CSV mode. To show the Mbps figure, rather than bps, on the y-axis output of the bar chart there are a couple of lines included in the Javascript code in bandwidth.php to perform the conversion:
	mbps = Math.round(bandwidth_data[i].download/1000).toFixed(3)/1000;
	bvalue = mbps.toLocaleString(undefined, { minimumFractionDigits: 3 });
Using toLocaleString should insert the correct decimal radix punctuation (a "." or ",") as set by your browser's locale setting but this is implementation dependent and somewhat inconsistent. If you see . instead of , and it annoys you then Globalize is the way to fix this. See '18 Further steps and ideas' below.
A few more lines are needed to over-ride the default hover code treatment of trailing zeroes, as chart.js normally will display "2.000" as just "2", which isn't what I want, especially after going to the trouble of ensuring that they are there in the first place:
    // we over-ride the default tooltip which drops trailing zeros even though we already put them there
    tooltips: {
        callbacks: {
            label: function(tooltipItem, data) {
                var value = data.datasets[0].data[tooltipItem.index];
                var label = 'download: ';
                var retvalue = value.toLocaleString(undefined, { minimumFractionDigits: 3 });
                return label + ' ' + retvalue + ' Mbps';
            }
        }
    },
This is a nice example of how you can 'drill-down' into chart.js and change the way it does things.
Also, I have set the chart options to print the timestamp on the x-axis for every bar:
	xAxes: [{
		ticks: {
			autoSkip: false,
			maxTicksLimit: 24
		}
The default option (with autoSkip set to true) resulted in a couple of odd looking gaps in the labels. You will need to change maxTicksLimit if you want to display something other than 24 entries.
If you want more help in changing any of the chart.js options or you cannot get what you want to work then please check out the specific chart.js Stack Overflow pages - there is a lot of useful info there - https://stackoverflow.com/questions/tagged/chart.js - Just use the search box to narrow down what you are looking for. Unfortunately, the chart.js documentation is lacking in some of the more advanced examples that would certainly be a great help to get up to speed using this terrific piece of open-source code.
15 Error handling
During my initial test runs, I noticed a couple of times that speedtest reported "Cannot retrieve speedtest server list" in the CSV file. Presumably this reflected the times when my broadband connection was so bad that speedtest couldn't connect to the test server at all. This text is obviously not in a format that we want to import in to the SQLite database so I needed a solution to this that would both drop this unwanted text from the CSV file and also include a zero entry in the database for the specific timeslot, as otherwise any missing entry in the SQL table would simply be invisible and also throw out the alignment I wanted of having 24 entries per day when creating the chart.
You will see in bandwidth.sh that the script tests the exit code set by speedtest using the script variable $? and if it is greater than zero this indicates that speedtest failed. This will trigger the function to create a dummy CSV entry - which is then used to overwrite the CSV file for that run.
There are a couple of lines in the bash script that are commented out but which will test this error routine to generate a dummy zero entry if you run the script after un-commenting those lines.
############################################
# test/debug case - forces speedtest to fail
############################################
# runTest "199999999"
# sleep 5
####### comment out after testing ##########
############################################
This uses a 'nonsense' server id that speedtest doesn't like thereby causing it to return a non-zero exit code. The script then should create a dummy entry which can sit happily in the SQL table and be ignored or you could delete it.
Another way to force speedtest to fail, for this testing purpose, would be to remove the network connection of the server. Don't forget that you can run the bandwidth.sh script manually at any time, you don't have to wait for the cronjob to fire it off, although you should avoid running it manually if a cronjob is imminent. Having two scripts running simultaneously would be likely to mess up the CSV files and then the SQL table.
If the worst happens then there is a back-up CSV file kept as /usr/local/etc/speedtest.bak which should contain all the CSV output from speedtest from the first run of the bash script onwards. This could be edited to remove any of the unwanted entries, the SQL table cleared and then the whole set of CSV entries re-imported into SQLite.
16 Time zones
Speedtest reports time in UTC (basically this is the same as Greenwich Mean Time or GMT). Using UTC means that all the times stored in the SQL table are consistent, and Daylight Saving Time will not have any unwanted impact.
But this means that the error handling routine in bandwidth.sh needs to create a timestamp for the dummy entry to reflect this. This is pretty simple - we just included the --utc flag:
local RIGHTNOW=$(date --utc +%Y-%m-%dT%H:%M:%SZ)
If you want the graph x-axis labels to show times as something other than UTC/GMT then the best place to make such a change would be in the SQL SELECT statement, e.g.:
strftime("%H:%M", time(times, 'localtime')) || " " || strftime("%d/%m/%Y", times) AS timestamp
This would use the timezone settings of your Linux server to adjust the times shown on the chart. Or you could dive in to figure out how Globalize could do this in the front-end.
See https://www.timeanddate.com/time/gmt-utc-time.html and http://www.tutorialspoint.com/sqlite/sqlite_date_time.htm for more information.
17 Further steps and ideas
Speedtest doesn't need to be the source of your raw data - it could come from anywhere and be for anything, not just internet speed. The principle is the same - a backend server process that can get the raw data in a useful format and then import it into SQLite from a bash script with a front-end that extracts the subset of data you want and then charts it.
A more complex bash script could write data directly to a SQL table (using the SQL INSERT command) if formatting as CSV is not an option. When you design the SQL table think about how you may want to extract the data later.
When making any changes bear in mind the context of the code you are editing; i.e. we have SQL statements inside PHP script inside Javascript inside HTML. Remember the level you are at and code accordingly. It can be easy to lose track and end up writing PHP code in what should be Javascript! I can guarantee this will not work.
Here are some ideas for further exploration:
- toLocaleString is not consistently implemented across browsers. Use Globalize and handle all number, date and timezone formats with it.
- Checkout httpstat (there is a bash script version) that allows different types of internet connection data to be collected. Store this in a (separate) SQL table and graph the output.
- Improve the bandwidth.php front-end to give the user the choice of different options: 24, 48, 72 hours; select a specific date, include upload and download data, ping times.
- Convert the HTML to use responsive Bootstrap code so that it runs nicely on different devices or screen sizes.
- Explore some of the other options of chart.js; maybe a combined line and bar chart; change the colours and bar size.
- replace SQLite with MySQL and add more security with read access from PHP via user/password.
- Build a similar system but using node.js.
18 Links
- speedtest: https://github.com/sivel/speedtest-cli
- SQLite3: https://sqlite.org/
- chart.js: http://www.chartjs.org/
- Globalize: https://github.com/globalizejs/globalize
- httpstat: https://github.com/b4b4r07/httpstat
- Bootstrap: http://getbootstrap.com/
- PHP: http://www.php.net/
- ISPConfig: http://www.ispconfig.org/
- Debian: http://www.debian.org/

