Add a new Host and Services to be Monitored by Icinga 2
In this tutorial, I will show you how to add a new host to be monitored by Icinga 2 and how the host’s services, such as a web HTTP server, can be monitored by Icinga. I will also show you how to create your own custom Icinga plugin command in order to monitor UDP services in your network infrastructure.
Icinga 2 provides a plug-in infrastructure that allows it to implement server and service checks as well as notifications easily. This fact allows system administrators and programmers to build new functionality for Icinga 2 and create special commands specialized in verifying different aspects of a host, a network service or a network functionality.
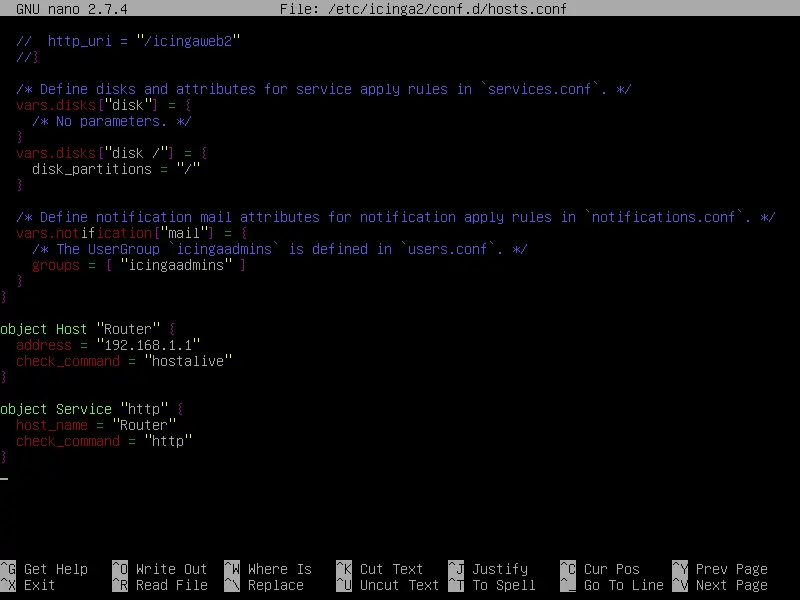
Icinga 2 stores Host definitions with object attributes used for service rules, notifications, dependency, and scheduled downtime objects in hosts.conf file which is located in /etc/icinga2/conf.d/ directory. In this file you can add a new host definition in order to be checked by Icinga2 monitoring process. In the below example we’ll add a new definition so that our default gateway router can be periodically checked by Icinga2 to see if it’s online via ICMP checks.
nano /etc/icinga2/conf.d/hosts.conf
Go to the end of file and add the following lines to add the new host definition.
object Host "Router" {
  address = "192.168.1.1"
  check_command = "hostalive"
}
For instance, on the main router we also want to check the status of the HTTP web server that is used for authentication and setups. The below lines will check the web server on the router to see if the HTTP server is alive and responds with the proper HTTP codes.
object Service "http" {
  host_name = "Router"
  check_command = "http"
}
In order for Icinga 2 to pick-up the new Host definitions and start periodically monitor the new resource, you need to restart the process by issuing the following command.
systemctl restart icinga2.service
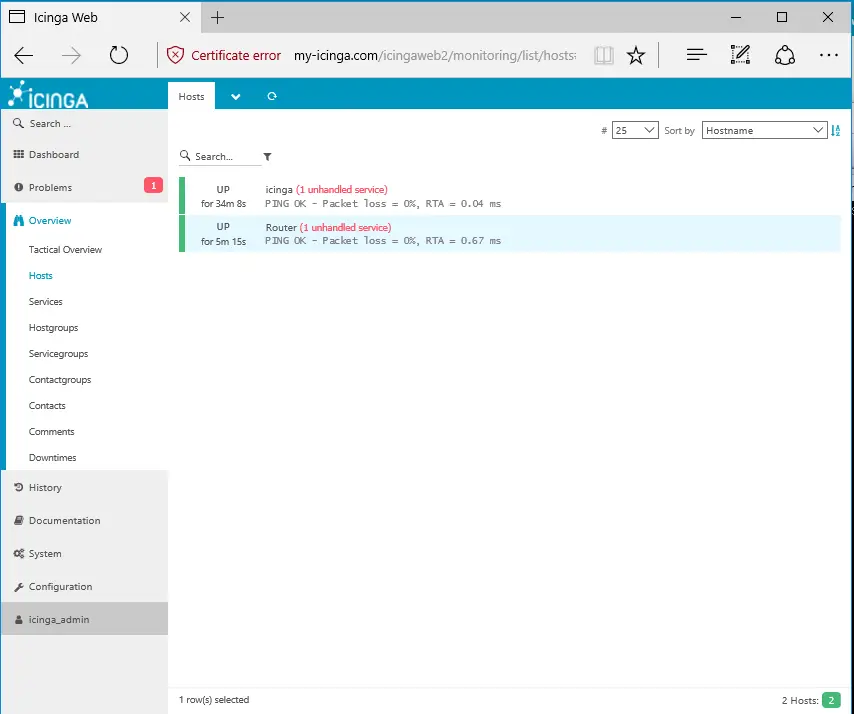
To verify the state of the newly added host, in this case, the router, log in to Icinga 2 Web panel and navigate to Overview -> Hosts. In the right plane, you should see the status of the newly added host, as illustrated in the below image which describes our router status. Hosts checks are basically performed via ICMP protocol and Icinga2 will display the round time trip average for a host in the web panel.
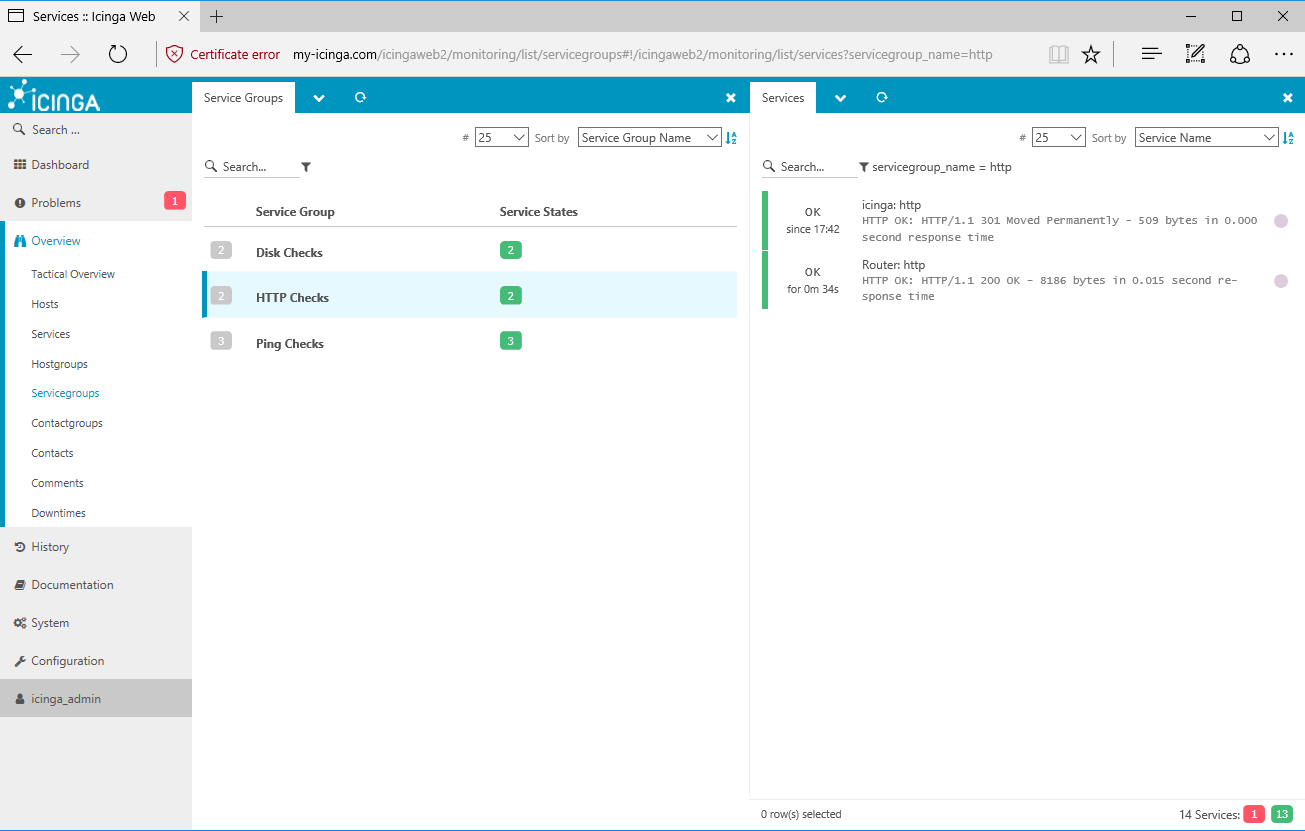
If you want to display the status of the host HTTP service checks, navigate to Overview -> Servicegroups and hit on HTTP Checks. In the right plane, you should see the status of the router HTTP service, as illustrated in the following screenshot.
Icinga 2 comes with a series of pre-defined commands that can be used to monitor a wide range of services. But those default commands sometimes are not enough to check custom services. In this case, one approach is to create your own custom command script that can be called by Icinga 2 to monitor the service. In the below example we’ll show you how to add a new custom command script in order to verify the state of different UDP services over your network. The custom command must be parameterized and must contain at least two parameters, in the form of –H hostname or IP and –p port number. The custom command script for verifying a UDP service port should be placed in the /usr/lib/nagios/plugins/ directory and should have the content as declared in the below sample.
nano /usr/lib/nagios/plugins/check_udpport
check_udpport file excerpt.
#!/bin/bash
while getopts H:p: option
do
 case "${option}"
 in
H) addr=${OPTARG};;
p) port=${OPTARG};;
 esac
done

/bin/nc -vz -u "$addr" "$port" > /dev/null 2>&1

stat=`echo $?`

if test $stat -eq 0; then
echo "Port $port is opened on $addr"
exit 0
else
echo "Port $port is not opened on $addr"
exit 2
fi

Let’s try to understand how this script works. As you can see the plugin is nothing else but a simple Bash script. We use a while control expression to loop through two parameters defined by H and p letters. The two H and p shell variables letters are parameterized and parsed as command line arguments using the case statement. The case statement will test if the parameters exist and will declare them for addr and port variables. Next, the $addr and $port variables will be added as command options for netcat command, which, in return will probe if the port number, defined in $port variable, is opened for the host with the IP address defined by $addr variable. The output of netcat command and eventual errors are of no interest for this plugin, so it will be discarded to the Linux blackhole /dev/null file. What we need is the netcat command exit code. After netcat will check the port on the host, will always return 0 exit code in case the probed UDP port is opened. The rest of the command is pretty simple. An if-else case conditional statement will print the following: if the UDP port is open on the specified IP address, print the string with the content ‘port is opened’ for that host IP address alongside with appending the exit code 0. 0 exit code is always the success or no error returned code by a process in Linux. If the UDP port is not open (exit code of netcat will be other than 0), print the string which says ‘the port is not opened’ for the host and append the exit code of 2. The exit codes added after each echo printed string in this script has a huge meaning for Icinga2 checks, as explained below.
Command Plugin Return Code for Service State or Host State in Icinga 2:
0 = OK for services and UP for hosts
1 = WARNING for services and UP or DOWN/UNREACHABLE for hosts (the host is flapping or changes its states frequently)
2 = CRITICAL for services and DOWN/UNREACHABLE for hosts
3 = UNKNOWN DOWN/UNREACHABLE
So basically, Icinga 2 will execute this script with host and port parameter and it will return two states: either the UDP port is not reachable and will alert you that the host’s UDP service is Critical or the UDP port is reachable and will inform you that the UDP service is running in good conditions and is OK.
After you’ve edited the script file, save and close it and make sure the file can be launched in execution by adding the execution permissions with the following command.
chmod +x /usr/lib/nagios/plugins/check_udpport
Then, in order to test if the script is working as expected, run the command against a UDP opened port and a UDP closed port over a host in your network by issuing the below syntax.
Here the TFTP server is checked for 192.168.1.2 host.
/usr/lib/nagios/plugins/check_udpport –H 192.168.1.2 –p 69
Simulate the checks against a UDP port you know for sure is closed
/usr/lib/nagios/plugins/check_udpport –H 192.168.1.2 –p 68

In order for this new custom plugin to be widely used in Icinga 2, add a new command definition in Icinga 2 command’s configuration file, as shown in the below example.
nano /etc/icinga2/conf.d/commands.conf
Go to the bottom of this file and add the command definition as follows:
object CheckCommand "myudp" {
  command = [ PluginDir + "/check_udpport" ]

    arguments = {
    "-H" = "$addr$"
    "-p" = "$port$"
  }
  vars.addr = "$address$"
}
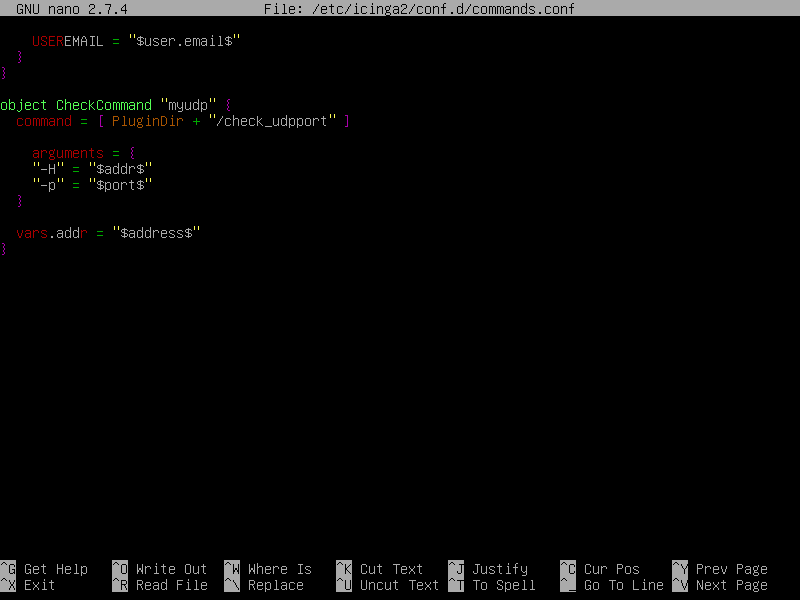
The name of the command that will be using in Icinga 2 configurations to call the ckeck_udpport command would be “myudp”. We don’t need to specify the address when we call the command for a service host definition because is hardcoded by Icinga 2 macro $address$ variable.
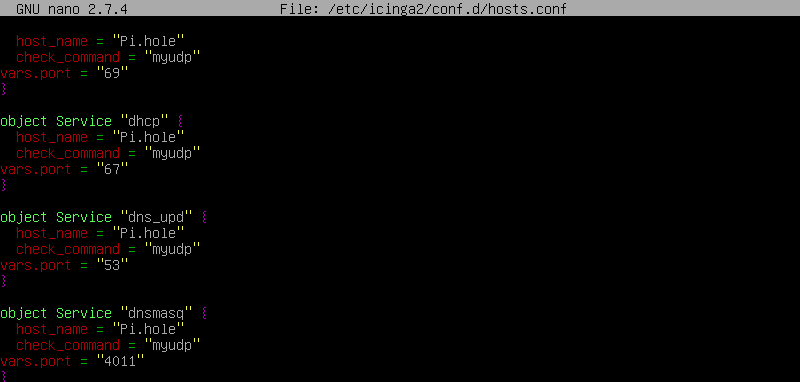
In order to check if the command is working as expected, add a new service definition for a host in order to check if a specific UDP service is opened or not over that host. For instance, to check if the DHCP port is opened for 192.168.1.2 host, add the below definition in Icinga2 hosts.conf file.
object Service "dhcp" {
  host_name = "Pi.hole"
  check_command = "myudp"
vars.port = "67"
}
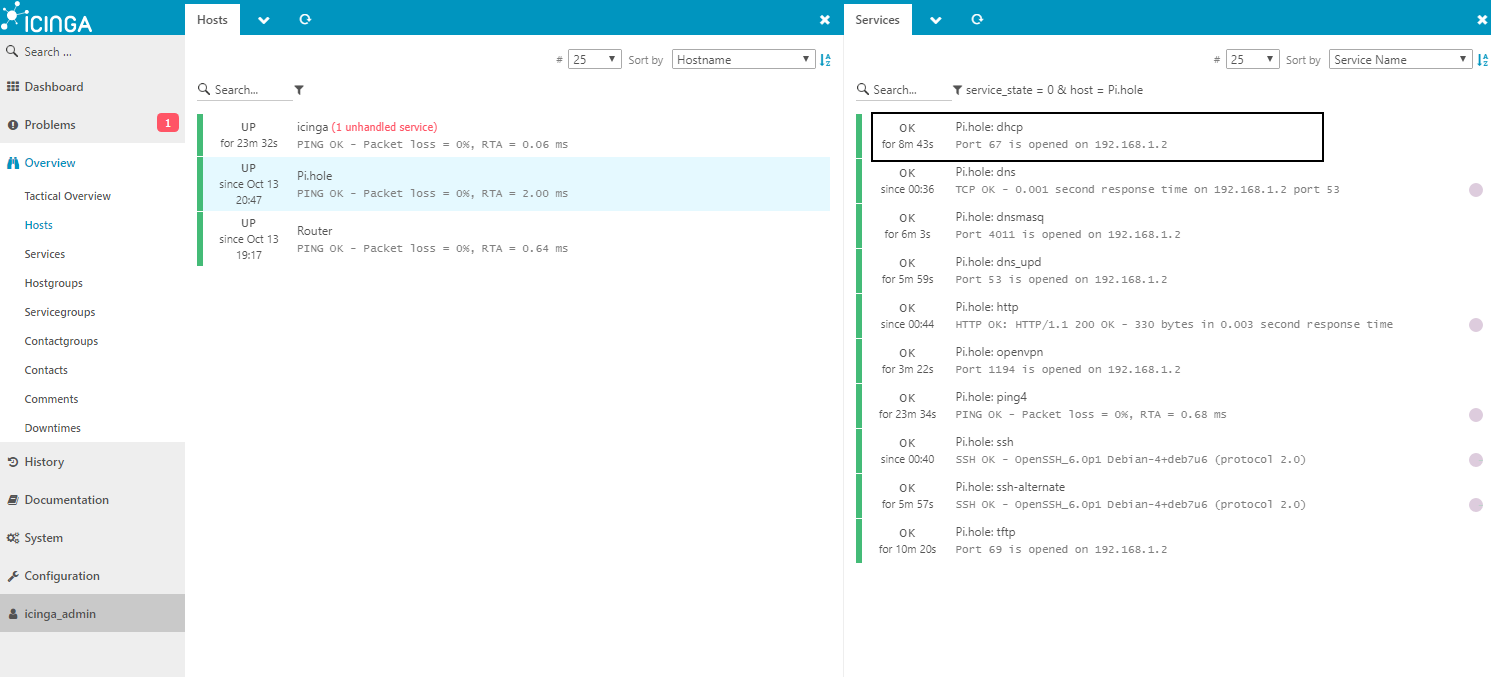
Afterwards, restart Icinga 2 to reflect changes and navigate to Icinga 2 Web panel, Overview -> Hosts, click on your specific host and verify the status of the UDP service status, as shown in the below screenshot.
That’s all! You have successfully added a host and it's services will be periodically checked by Icinga 2 network monitoring application. For other custom configurations regarding Icinga 2 monitoring engine and custom command script, visit the documentation page at the following address: https://www.icinga.com/docs/icinga2/latest/doc/03-monitoring-basics/#check-commands

