How to Write a Custom Nagios Check Plugin
This tutorial was tested using Nagios Core 4.3.4 on Debian 9.2
Even though Nagios Exchange has thousands of available plugins to freely download, sometimes the status needed to be checked is very specific for your scenario.
Considerations
It is assumed that:
- You have Nagios installed and running (You can follow this Tutorial if not).
- You know the basics on Nagios administration.
Nagios server in this example is hosted on 192.168.0.150 and an example client is hosted on IP 192.168.0.200
Exit Codes
To identify the status of a monitored service, Nagios runs a check plugin on it. Nagios can tell what the status of the service is by reading the exit code of the check.
Nagios understands the following exit codes:
- 0 - Service is OK.
- 1 - Service has a WARNING.
- 2 - Service is in a CRITICAL status.
- 3 - Service status is UNKNOWN.
A program can be written in any language to work as a Nagios check plugin. Based on the condition checked, the plugin can make Nagios aware of a malfunctioning service.
Example Plugin
I will use a simple example. I wrote a plugin in a bash script to check for current Warnings. Let's consider I have the Nagios server configured to alert only on critical status, so I want an alert if I have too many services on a Warning status.
Consider the following script (check_warnings.sh):
#!/bin/bash

countWarnings=$(/usr/local/nagios/bin/nagiostats | grep "Ok/Warn/Unk/Crit:" | sed 's/[[:space:]]//g' | cut -d"/" -f5)

if (($countWarnings<=5)); then
                echo "OK - $countWarnings services in Warning state"
                exit 0
        elif ((6<=$countWarnings && $countWarnings<=30)); then
				# This case makes no sense because it only adds one warning.
				# It is just to make an example on all possible exits.
                echo "WARNING - $countWarnings services in Warning state"
                exit 1
        elif ((30<=$countWarnings)); then
                echo "CRITICAL - $countWarnings services in Warning state"
                exit 2
        else
                echo "UNKNOWN - $countWarnings"
                exit 3
fi
Based on the information provided by the nagiostats tool, I assume everything is ok if there are five or less services in Warning state.
I will leave this script with all the other Nagios plugins inside /usr/local/nagios/libexec/ (This directory may be different depending on your confiugration).
Like every Nagios plugin, you will want to check from the command line before adding it to the configuration files.
Remember to allow the execution of the script:
sudo chmod +x /usr/local/nagios/libexec/check_warnings.sh
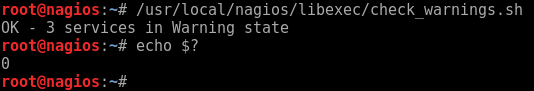
And then run it as any other script:
![]()
The result is a text message and an exit code:
Set a New Checking Command and Service
This step will be the same with your own plugins, and if you download a third-party plugin from the internet as well.
First you should define a command in the commands.cfg file. This file location depends on the configuration you've done, in my case it is in /usr/local/nagios/etc/objects/commands.cfg.
So I will add at the end of the file the following block:
# Custom plugins commands...
define command{
	command_name check_warnings
	command_line $USER1$/check_warnings.sh
}
Remember that the $USER1$ variable, is a local Nagios variable set in the resource.cfg file, in my case pointing to /usr/local/nagios/libexec.
After defining the command you can associate that command to a service, and then to a host. In this example we are going to define a service and assign it to localhost, because this check is on Nagios itself.
Edit the /usr/local/nagios/etc/objects/localhost.cfg file and add the following block:
# Example - Check current warnings...
define service{
	use local-service
	host_name localhost
	service_description Nagios Server Warnings
	check_command check_warnings
}
Now we are all set, the only thing pending is reloading Nagios to read the configuration files again.
Always remember, prior to reloading Nagios, check that there are no errors in the configuration. You do this with nagios -v command as root:
sudo /usr/local/nagios/bin/nagios -v /usr/local/nagios/etc/nagios.cfg
You should get something like this:
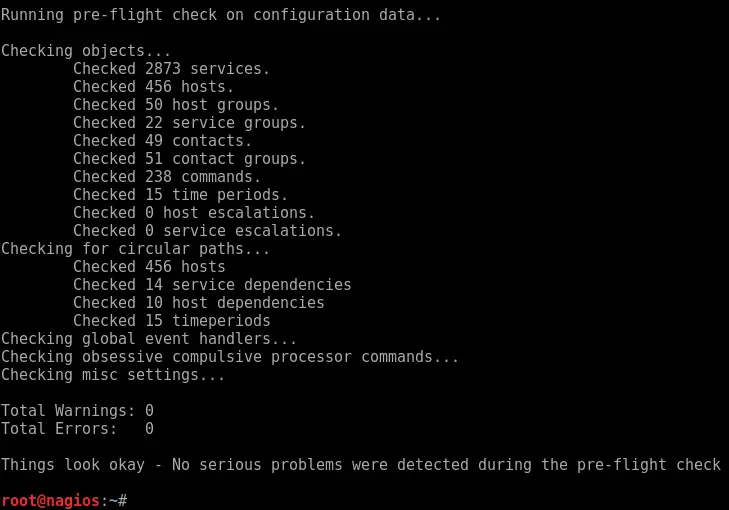
Ensure it returns 0 errors and 0 warnings and proceed to reload the service:
sudo systemctl reload-or-restart nagios.service
After reloading the service, you will see the associated check in the localhost. First as pending:
![]()
And after the execution with its result:
![]()
Use NRPE to run on Clients
To run a script on a remote client, you will need to set up the Nagios Remote Plugin Executor (NRPE)
As this tutorial is based on Debian 9, I will show as an example how to install it, but you can find instructions for any distribution.
Generic installation on Debian-based Client
Note that all the configuration in this section is done on the client to be checked, not in the nagios server.
Install NRPE and Nagios plugins:
sudo apt-get install libcurl4-openssl-dev nagios-plugins nagios-nrpe-server nagios-nrpe-plugin --no-install-recommends
sudo ln -s /usr/lib/nagios/plugins/check_nrpe /usr/bin/check_nrpe
Allow Nagios server to run commands on the client by adding it to the allowed_hosts entry in /etc/nagios/nrpe.cfg. The line should look like:
allowed_hosts=127.0.0.1,::1,192.168.0.150
Define the standard checks that you will perform on every client with NRPE. Define the checks on /etc/nagios/nrpe_local.cfg. For instance, a model for the file could be:
######################################
# Do any local nrpe configuration here
######################################
#-----------------------------------------------------------------------------------
# Users
   command[check_users]=/usr/lib/nagios/plugins/check_users -w 5 -c 10

# Load
   command[check_load]=/usr/lib/nagios/plugins/check_load -w 15,10,5 -c 30,25,20
   command[check_zombie_procs]=/usr/lib/nagios/plugins/check_procs -w 5 -c 10 -s Z
   command[check_total_procs]=/usr/lib/nagios/plugins/check_procs -w 150 -c 200

# Disk
   command[check_root]=/usr/lib/nagios/plugins/check_disk -w 20% -c 10% -p /
   command[check_boot]=/usr/lib/nagios/plugins/check_disk -w 20% -c 10% -p /boot
   command[check_usr]=/usr/lib/nagios/plugins/check_disk -w 20% -c 10% -p /usr
   command[check_var]=/usr/lib/nagios/plugins/check_disk -w 20% -c 10% -p /var
   command[check_tmp]=/usr/lib/nagios/plugins/check_disk -w 20% -c 10% -p /tmp
   # If you want to add a non-standard mount point:
   # command[check_mnt1]=/usr/lib/nagios/plugins/check_disk -w 4% -c 1% -p /export
#-----------------------------------------------------------------------------------
The idea of having that generic file is so that you can check the same on every client.
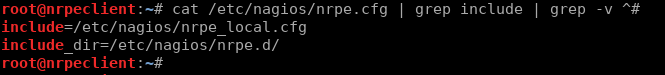
Ensure that the local file and .d directory are included in the main configuration file with:
cat /etc/nagios/nrpe.cfg | grep include | grep -v ^#
Restart the service:
sudo systemctl restart nagios-nrpe-server.service
Check that the NRPE service is running:
cat /etc/services | grep nrpe
netstat -at | grep nrpe
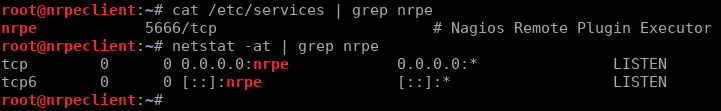
Now check one of the previously defined NRPE commands from the Nagios server:
![]()
Note that the check_users NRPE command was defined in the /etc/nagios/nrpe_local.cfg file to run /usr/lib/nagios/plugins/check_users -w 5 -c 10.
In case you don't have the plugin in the Nagios server, you can install it with:
sudo apt-get install nagios-nrpe-plugin
So, summarizing, the NRPE will run a script in a remote host, and return the exit code to the Nagios server.
Configuration for Custom Scripts
To use a custom script as a plugin to run remotely through NRPE, you should first write the script on the server, for instance in /usr/local/scripts/check_root_home_du.sh:
#!/bin/bash

homeUsage=$(du -s /root/ | cut -f1)

if (($homeUsage<=$((1024*1024)))); then
                echo "OK - Root home usage is $(du -sh /root/ | cut -f1)"
                exit 0
        elif (($((1024*1024))<$homeUsage && $homeUsage<=$((3*1024*1024)))); then
                echo "WARNING - Root home usage is $(du -sh /root/ | cut -f1)"
                exit 1
        elif (($((3*1024*1024))<$homeUsage)); then
                echo "CRITICAL - Root home usage is $(du -sh /root/ | cut -f1)"
                exit 2
        else
                echo "UNKNOWN - Value received: $homeUsage"
                exit 3
fi
Allow the execution of the script:
sudo chmod +x /usr/local/scripts/check_root_home_du.sh
The previous script is a very simple example, checking the disk usage of the directory /root and setting a threshold for considering it OK, Warning or Critical.
Add the command to the NRPE configuration file on the client (/etc/nagios/nrpe_local.cfg):
# Custom
   command[check_root_home_du]=/usr/local/scripts/check_root_home_du.sh
And restart the NRPE listener:
sudo systemctl restart nagios-nrpe-server.service
Now we can access the server and test it like any standard plugin
![]()
Set the NRPE Check on the Server Configuration Files
Now we know that the custom plugin is working on the client and on the server, and that the NRPE is communicating correctly, we can go ahead and configure Nagios files for checking the remote device. So in the server set the files:
/usr/local/nagios/etc/objects/commands.cfg:
#...
define command{
	command_name check_nrpe
	command_line /usr/lib/nagios/plugins/check_nrpe -H $HOSTADDRESS$ -c $ARG1$
}
/usr/local/nagios/etc/objects/nrpeclient.cfg:
define host{
    use          linux-server
    host_name    nrpeclient
    alias        nrpeclient
    address      192.168.0.200
}

define service{
	use                 local-service
	host_name           nrpeclient
	service_description Root Home Usage
	check_command       check_nrpe!check_root_home_du
}
Note that the ! mark separates the command from the arguments in the check_command entry. This defines that check_nrpe is the command and check_root_home_du is the value of $ARG1$.
Also, depending on your configuration you should add this last file to the main file (/usr/local/nagios/etc/nagios.cfg):
#...
cfg_file=/usr/local/nagios/etc/objects/nrpeclient.cfg
#...
Check the configuration and, if no errors or warnings, reload the service:
/usr/local/nagios/bin/nagios -v /usr/local/nagios/etc/nagios.cfg
sudo systemctl reload-or-restart nagios.service
And now you have a new custom check on a host:
![]()
Conclusion
Nagios has a huge library of plugins available at Nagios Exchange. However, in a big environment it is very likely to need some custom checks for specific uses, for instance: Checking on a certain task result, monitoring an in-house developed application, among others.
The flexibility provided by Nagios is perfect for these case scenarios.

