
iostat command is used to monitor CPU utilization and I/O (input /output) statistics of all the disks and file systems. nfsiostat command is used to monitor i/o statistics of network file system(NFS).
iostat command monitor the I/O (Input/Output) devices loading by means of observing the time, devices are active with respect to their average transfer rates. This command is especially helpful for generating reports that we can use to optimize the system’s input & output load.
iostat command generally generates two reports:
- CPU utilization report
- All disks i/o statistics report
To generate the reports, iostat command reads some of the system files . These files are,
- /proc/diskstats for disk stats
- /proc/stat for system stats
- /sys for block device stats
- /proc/devices for persistent device names
- /proc/self/mountstats for all the network filesystems
- /proc/uptime for information regarding system uptime
In this tutorial, we will learn how to install iostat utility on Linux systems and then we will discuss how to generate reports using iostat command,
Iostat Installation on Linux Systems:
iostat is a part of ‘sysstat‘ package, we can install it on our system using the following command,
CentOS/RedHat
[root@linuxtechi ~]# yum install sysstat -y
Ubuntu/Debian
$ sudo apt-get install sysstat -y
Fedora
[root@linuxtechi ~]# dnf install sysstat -y
Now let’s check out some examples to understand the iostat command better.
Example:1 Get complete statistics (CPU & Devices)
To get the complete statistics for the system, open terminal & execute the following command,
[root@linuxtechi ~]# iostat
This will produce the following output on the screen,
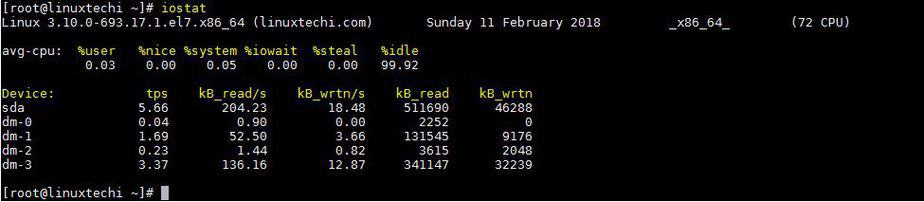
Here in the iostat command output,
- %user, is CPU utilization for the user,
- %nice, is the CPU utilization for apps with nice priority,
- %system, is the CPU being utilized by the system,
- %iowait, is the time percentage during which CPU was idle but there was an outstanding i/o request,
- %steal, percentage of time CPU was waiting as the hypervisor was working on another CPU,
- %idle, is the percentage of time system was idle with no outstanding request.
Devices, shows the name of all the devices on system,
- Tps, is the short for transfer per second,
- Blk_read/s & Blk_write/s are the transfer speed for read and write operations,
- Blk_read & Blk_write shows the total number of blocks read & written.
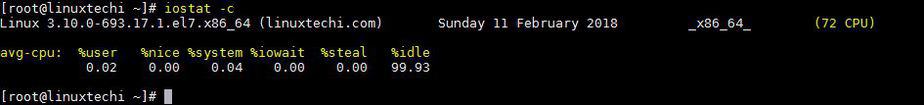
Example:2 Generate only CPU stats
To only generate the CPU statistics for the system, we will use options ‘c’ with iostat. Run the following command from terminal,
[root@linuxtechi ~]# iostat -c
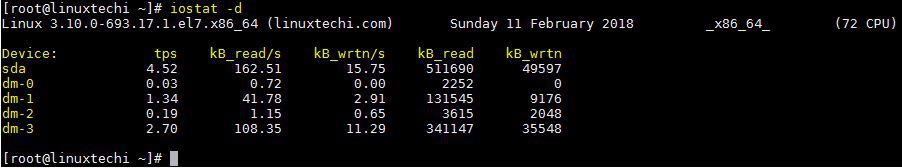
Example:3 To Generate i/o statistics for all the devices (-d option)
To get the iostat report only for the devices connected on the system, we will use option ‘d’ with iostat command,
[root@linuxtechi ~]# iostat -d
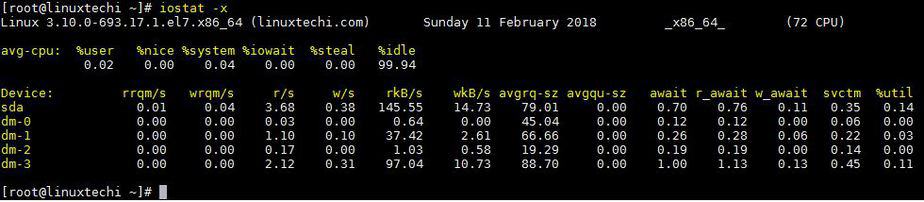
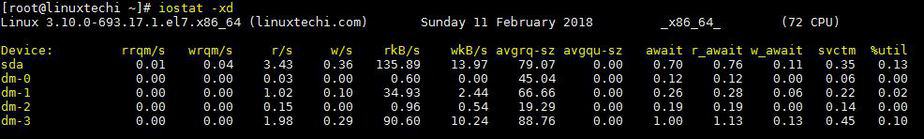
Example:4 Generate detailed i/o statistics
Though usually the stats provide by iostat command are sufficient but if you wish to get even more detailed statistics, we can use ‘-x’ option along with iostat command. Example is shown below,
[root@linuxtechi ~]# iostat -x
Example:5 Generate detailed reports for devices & CPU separately
To get the detailed information regarding the devices on the system, we will use option ‘d’ along with option ‘x’,
[root@linuxtechi ~]# iostat -xd
Similarly, for generating the detailed information for CPU, we will use options ‘c’ & ‘x’,
[root@linuxtechi ~]# iostat -xc
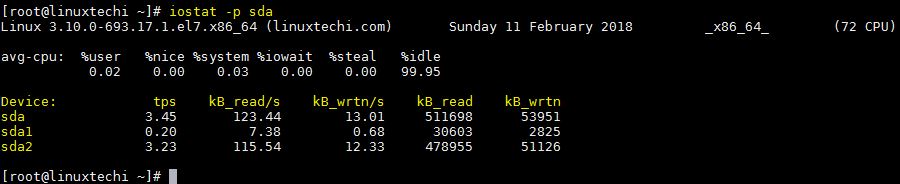
Example:6 Getting i/o statistics for a single device
iostat can also provide the i/o statistics for a single device. To get the statistics of a device, execute iostat command along with option ‘p’ followed by device name,
[root@linuxtechi ~]# iostat -p sda
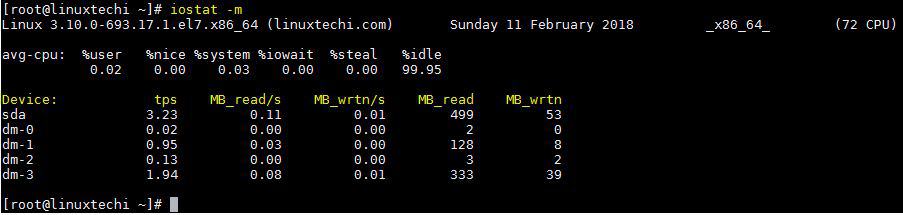
Example:7 Generate reports in either MB or KB
We can also generate the system statistics in either Megabytes or kilobytes units. To generate the reports in mb, we will use option ‘m’ with iostat command,
[root@linuxtechi ~]# iostat -m
Similarly, we can also generate the reports in kb unit format with option ‘k’,
[root@linuxtechi ~]# iostat -k
Example:8 Generating system i/o statistics report with delay
To capture the system statistics with a delay, we can mention the iostat command followed by interval in seconds & number of reports required,
[root@linuxtechi ~]# iostat 3 2
In this example, we are capturing 2 reports at 3 seconds interval,
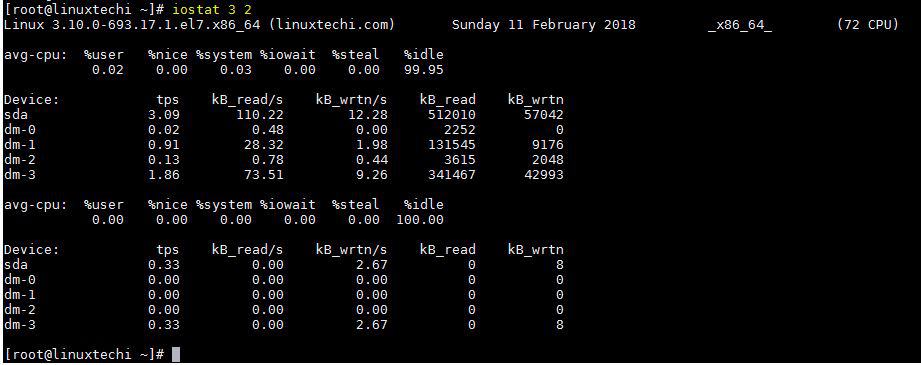
We can also use the delay parameter along with other options of iostat command that we discussed above.
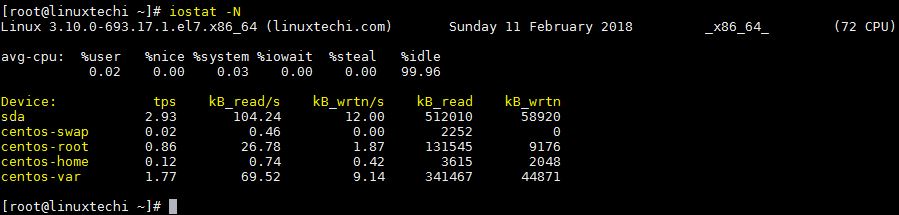
Example:9 Generate the LVM statistics report
To generate the LVM statistics, we can use option ‘N’ with iostat command,
[root@linuxtechi ~]# iostat -N
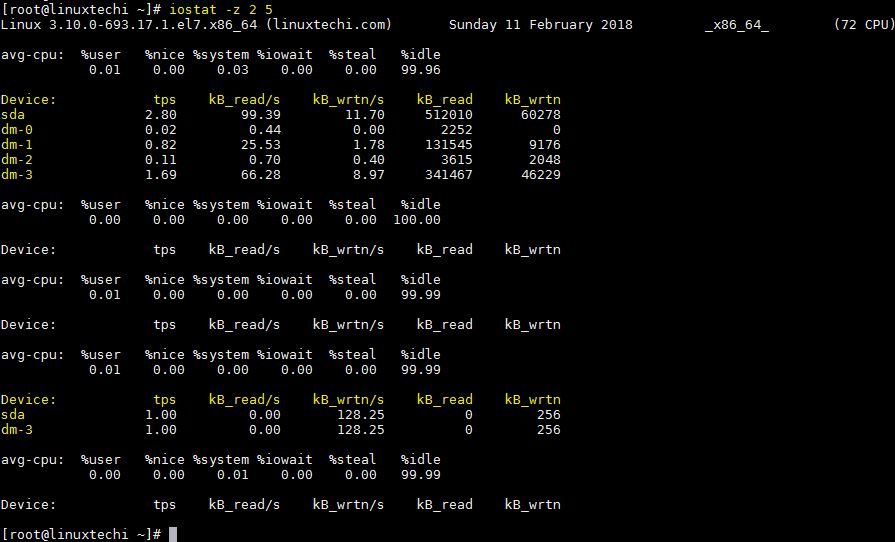
Example:10 Generate the reports for only active devices
We can also generate reports for devices that are active & omit out devices from reports that are inactive for sample period. We will use option ‘z’ with iostat command to accomplish this,
[root@linuxtechi ~]# iostat -z 2 5
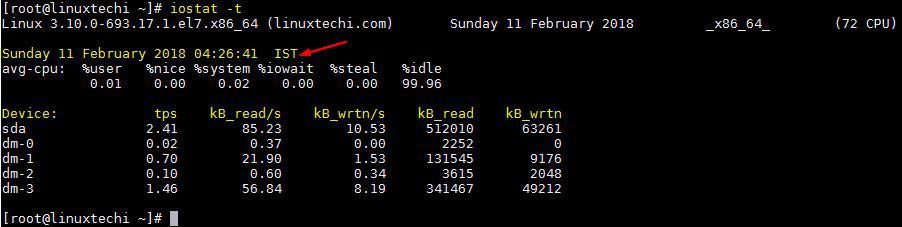
Example:11 Generate iostat reports with timestamp
To generate the iostat reports with a timestamp, we will use option ‘t’ along with iostat command,
[root@linuxtechi ~]# iostat -t
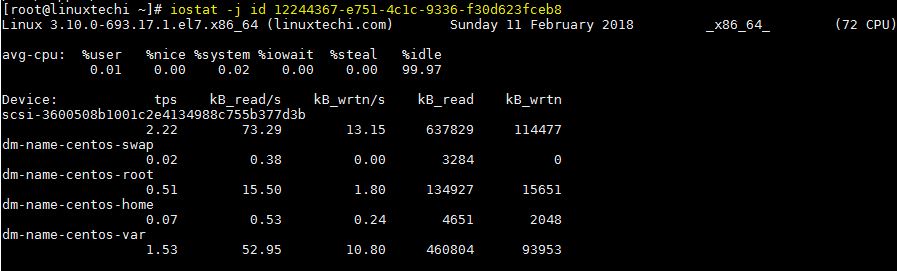
Example:12 Generate statistics report based on persistent device name
To get the report based on the persistent name of the device, we will use the option ‘j’ followed by keyword ‘ID’ & device persistent name,
Use blkid command to find the UUID of the disk.
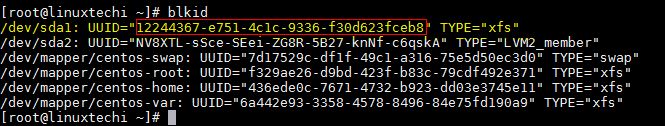
Once you find the UUID / ID then use the below iostat command,
[root@linuxtechi ~]# iostat -j id 12244367-e751-4c1c-9336-f30d623fceb8
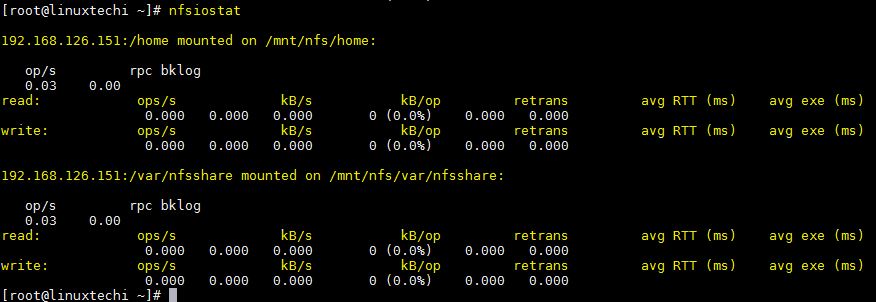
Example:13 Generate i/o statistics for Network File System(NFS)
We can use nfsiostat command to generate the NFS i/o statistics reports. nfsiostat command is the part of the package ‘nfs-utils’. Let’s assume we have mounted two NFS shares on our server, so to generate the statistics report for NFS share run the below command,
[root@linuxtechi ~]# nfsiostat
Example:14 Generate System I/O statistics report over a period of time
iostat command generate the live i/o statistics of your system and if you want to view the statistics reports over a period of time (back date system i/o statistics) then we should use sar utility. Sar command is also provided by the package ‘sysstat’
Read Also : “Generate CPU, Memory and I/O report using SAR command”
That’s it guys, we have covered all the options/parameters that can be used with iostat command. You can try mixing these options to get more desired/detailed results. Please do mention any query or question that you have regarding the tutorial.