Python is a very popular general purpose programming language — with good reason. It’s object oriented, semantically structured, extremely versatile, and well supported. Programmers and data scientists favour Python because it’s easy to use and learn, offers a good set of built-in features, and is highly extensible. Python’s readability makes it an excellent first programming language.
Data visualization is an important method of exploring data and sharing results with others. When it comes to this field, Python is rubbing shoulders with R as the language of choice. Unfortunately, Python’s visualization landscape is pretty difficult to fathom without some serious digging. In part, this is because there are so many good open source Python visualization libraries available. Some of the packages are suitable for any field, others excel at a specific task.
If you wish to visualize some data in Python, you’ll want to choose an appropriate package. Python has a fantastic range of packages to produce mesmerizing visualizations. Popularity inevitably brings lots of decisions and choices to make. Don’t be bamboozled by that choice!
matplotlib emerged as the main data visualization library. It’s been in development for many years and is definitely the most mature library recommended here. However, it’s not necessarily the ideal solution, given that the best library is often determined by your own specific requirements.
For example, let’s say you wish to analyze and visualize big data. In this scenario, VisPy and Datashader are good Python solutions. When working with large datasets, visualizations are often the only way available to understand the properties of that dataset — there are way too many data points to examine each one.
This article focuses on the finest Python visualization packages. All of them are released under an open source license.
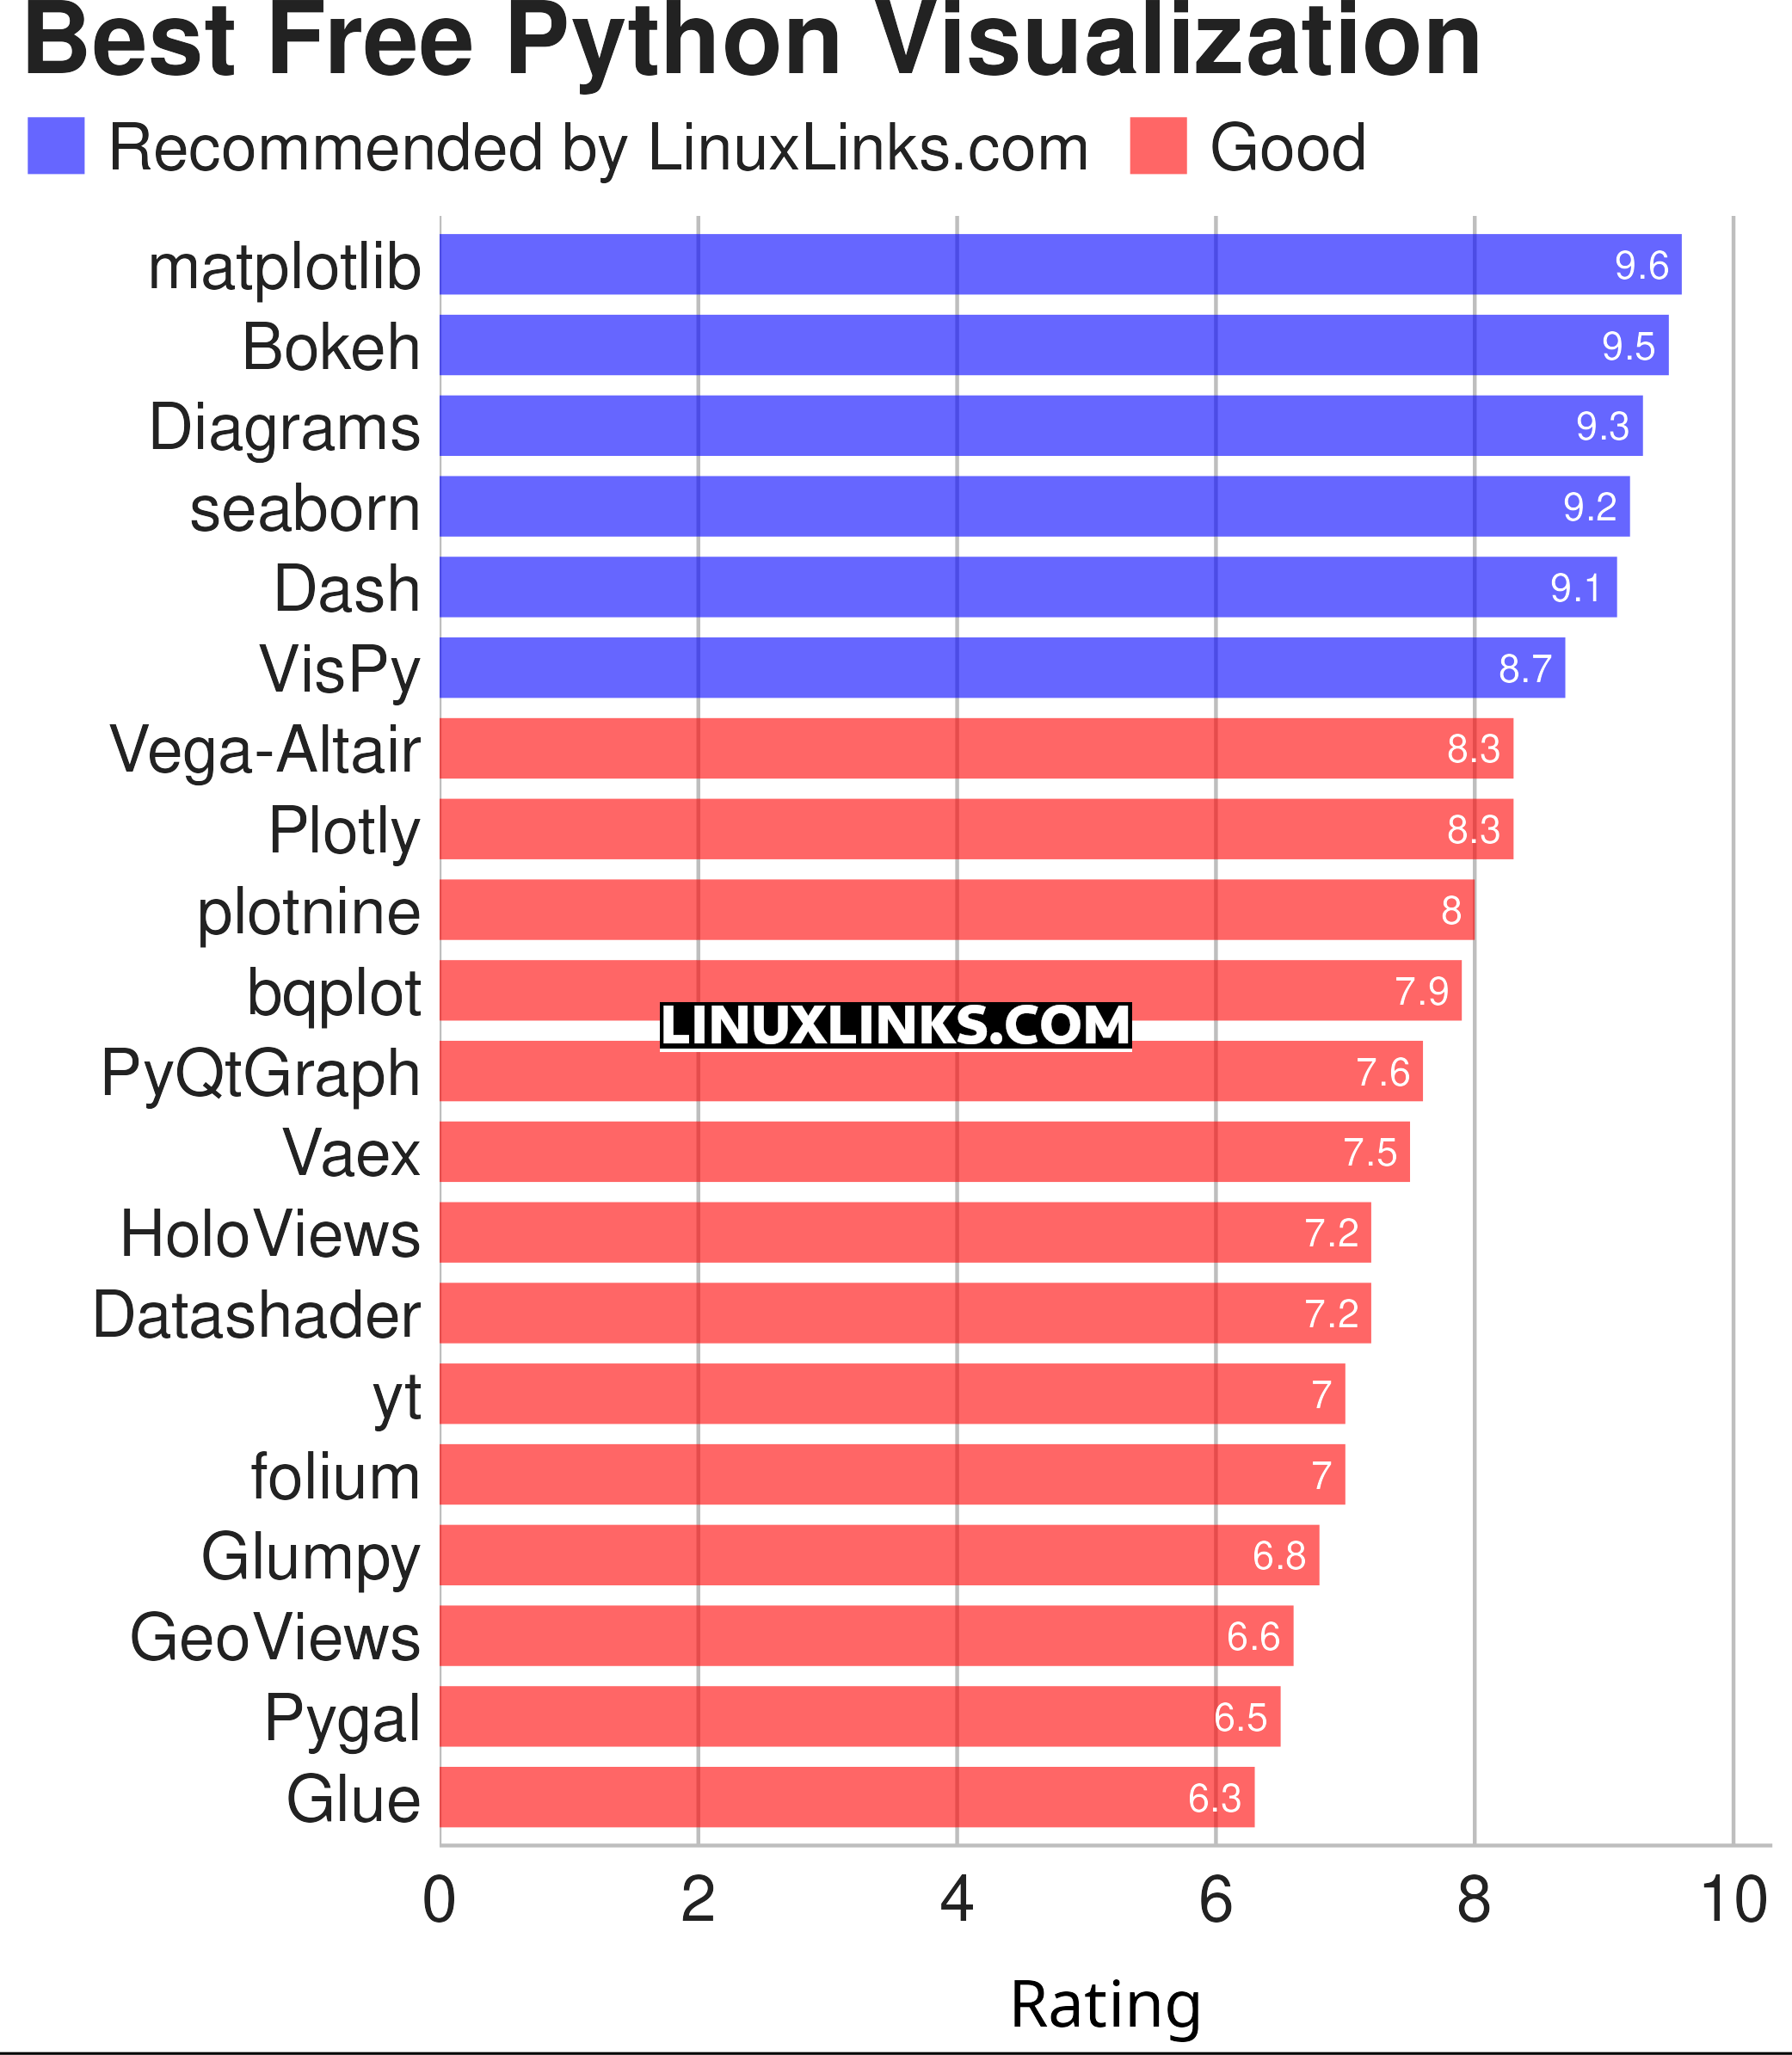
| Python Visualization Packages | |
|---|---|
| matplotlib | Python 2D plotting library which produces publication quality figures |
| Bokeh | Elegant, concise construction of versatile graphics |
| Diagrams | Draw the cloud system architecture in Python code |
| seaborn | Python visualization library based on matplotlib |
| Dash | Python framework for building analytical web applications |
| VisPy | Visualize massive datasets in real time |
| Vega-Altair | Declarative Visualization in Python |
| Plotly | Interactive, browser-based graphing library for Python |
| plotnine | Grammar of graphics for Python |
| bqplot | Interactive Plotting Framework for the Jupyter Notebook |
| PyQtGraph | Python graphics and GUI library built on PyQt4 / PySide and numpy |
| Vaex | Fast visualization of big data |
| HoloViews | Make Data Analysis and Visualization Seamless |
| Datashader | Generates aggregate arrays and representations of them as images |
| yt | Multi-code Toolkit for Analyzing and Visualizing Volumetric Data |
| folium | Visualize data in a Leaflet map |
| Glumpy | Intuitive interface between NumPy and modern OpenGL |
| GeoViews | Explore and visualize geographical, meteorological, and oceanographic datasets |
| Pygal | Dynamic SVG charting library |
| Glue | Multi-dimensional linked-data exploration |
This article has been revamped in line with our recent announcement.
A few additional packages are also worth a mention, if only because they met our needs for memorable projects:
- missingno – provides a small toolset of flexible and easy-to-use missing data visualizations and utilities.
- Biggles – a simple, object-oriented plotting library for creating publication-quality 2D scientific plots. It’s good if you have modest requirements.
- ggplot – a plotting system for Python that is based on ggplot2, a popular plotting system for R.
There are, of course, many other Python packages that are competent for visualizing data, but which are unfamiliar to us. Feel free to share in the comments alternative open source Python packages you love, what you used them for, and why you admire them.
Background information about Python for the uninitiated
Python is a general-purpose high-level programming language. Its design philosophy emphasizes programmer productivity and code readability. It has a minimalist core syntax with very few basic commands and simple semantics, but it also has a large and comprehensive standard library, including an Application Programming Interface (API).
It features a fully dynamic type system and automatic memory management, similar to that of Scheme, Ruby, Perl, and Tcl, avoiding many of the complexities and overheads of compiled languages. The language was created by Guido van Rossum in 1991, and continues to grow in popularity, in part because it is easy to learn with a readable syntax. The name Python derives from the sketch comedy group Monty Python, not from the snake.
The prominence of Python is, in part, due to its flexibility, with the language frequently used by web and desktop developers, system administrators, data scientists, and machine learning engineers. It’s easy to learn and powerful to develop any kind of system with the language. Python’s large user base offers a virtuous circle. There’s more support available from the open source community for budding programmers seeking assistance.
 Read our complete collection of recommended free and open source software. Our curated compilation covers all categories of software. Read our complete collection of recommended free and open source software. Our curated compilation covers all categories of software. Spotted a useful open source Linux program not covered on our site? Please let us know by completing this form. The software collection forms part of our series of informative articles for Linux enthusiasts. There are hundreds of in-depth reviews, open source alternatives to proprietary software from large corporations like Google, Microsoft, Apple, Adobe, IBM, Cisco, Oracle, and Autodesk. There are also fun things to try, hardware, free programming books and tutorials, and much more. |