


Have you used the top utility in a terminal to see memory usage on your Fedora system? If so, you might be surprised to see some of the numbers there. It might look like a lot more memory is consumed than your system has available. This article will explain a little more about memory usage, and how to read these numbers.
Memory usage in real terms
The way the operating system (OS) uses memory may not be self-evident. In fact, some ingenious, behind-the-scenes techniques are at play. They help your OS use memory more efficiently, without involving you.
Most applications are not self contained. Instead, each relies on sets of functions collected in libraries. These libraries are also installed on the system. In Fedora, the RPM packaging system ensures that when you install an app, any libraries on which it relies are installed, too.
When an app runs, the OS doesn’t necessarily load all the information it uses into real memory. Instead, it builds a map to the storage where that code is stored, called virtual memory. The OS then loads only the parts it needs. When it no longer needs portions of memory, it might release or swap them out as appropriate.
This means an app can map a very large amount of virtual memory, while using less real memory on the system at one time. It might even map more RAM than the system has available! In fact, across a whole OS that’s often the case.
In addition, related applications may rely on the same libraries. The Linux kernel in your Fedora system often shares memory between applications. It doesn’t need to load multiple copies of the same library for related apps. This works similarly for separate instances of the same app, too.
Without understanding these details, the output of the top application can be confusing. The following example will clarify this view into memory usage.
Viewing memory usage in top
If you haven’t tried yet, open a terminal and run the top command to see some output. Hit Shift+M to see the list sorted by memory usage. Your display may look slightly different than this example from a running Fedora Workstation:
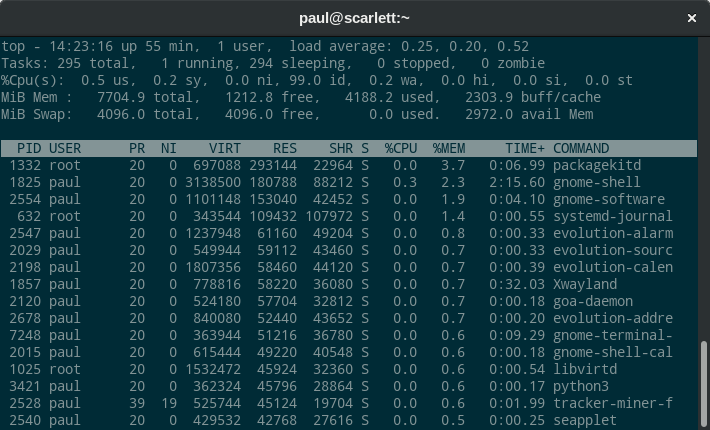
There are three columns showing memory usage to examine: VIRT, RES, and SHR. The measurements are currently shown in kilobytes (KB).
The VIRT column is the virtual memory mapped for this process. Recall from the earlier description that virtual memory is not actual RAM consumed. For example, the GNOME Shell process gnome-shell is not actually consuming over 3.1 gigabytes of actual RAM. However, it’s built on a number of lower and higher level libraries. The system must map each of those to ensure they can be loaded when necessary.
The RES column shows you how much actual (resident) memory is consumed by the app. In the case of GNOME Shell, that’s about 180788 KB. The example system has roughly 7704 MB of physical memory, which is why the memory usage shows up as 2.3%.
However, of that number, at least 88212 KB is shared memory, shown in the SHR column. This memory might be, for example, library functions that other apps also use. This means the GNOME Shell is using about 92 MB on its own not shared with other processes. Notice that other apps in the example share an even higher percentage of their resident memory. In some apps, the shared portion is the vast majority of the memory usage.
There is a wrinkle here, which is that sometimes processes communicate with each other via memory. That memory is also shared, but can’t necessarily be detected by a utility like top. So yes — even the above clarifications still have some uncertainty!
A note about swap
Your system has another facility it uses to store information, which is swap. Typically this is an area of slower storage (like a hard disk). If the physical memory on the system fills up as needs increase, the OS looks for portions of memory that haven’t been needed in a while. It writes them out to the swap area, where they sit until needed later.
Therefore, prolonged, high swap usage usually means a system is suffering from too little memory for its demands. Sometimes an errant application may be at fault. Or, if you see this often on your system, consider upgrading your machine’s memory, or restricting what you run.
Photo courtesy of Stig Nygaard, via Flickr (CC BY 2.0).

Leslie Satenstein
Thank you for this very useful expository of Linux hosting Gnome and the impact to memory consumption.
Does Linux provide historical measures or stats about the I/O activity for swapping?
Yury D
No, it doesn’t(apart from wait indicator—0.2 wa in the screenshot), but atop does.
Diego Roberto dos Santos
Hi Leslie,
In short you need to enable sysstat to collect system activity information, then these data will be stored in disk under the “/var/log/sa” directory and later you will be able to review historical by querying this files using the sar command. For further examples, please see [1][2].
[1] https://github.com/sysstat/sysstat
[2] https://www.thegeekstuff.com/2011/03/sar-examples/
Leslie Satenstein
Hola Diego,
Gracias. I do know a little more Spanish, as my wife taught me to listen and learn. It is her mother tongue.
I am definitely going to refer to and setup some testing with sysstat. My intention is to use sysstat for a month after a new installation of a Fedora Releases
Martin
There is iotop for I/O and iftop for network traffic monitoring. Historical data is not retained by my knowledge.
Kerel
Paul, what’s an easy way to see if your system relies a lot on swap memory?
Yury D
I usually look at the how much swap space is used, activity of the kswapd process, and how much exercise the swap partitions get. atop is much better at display that last than top, in my opinion.
alex
What about processes like apache/httpd that show up in
with all their forks , and every one of them are displayed as using memory/cpu.
How do you interpret that ?
Einer
Leslie Satenstein,
Yes, you can do this a multitude of ways. SAR is the most commonly used.
Kerel,
Depends ….. but SAR can usually give you some idea or you’ll be looking at top for quite some time to catch/estimate the swap area usage.
Alex,
On multithreaded apps, like httpd, the memory reported by top for the thread is the same as the parent … all threads of the parent process share the parents space … so, the parent process is the one you would usually look at and use as a guide for usage. That having been said, there are cases when you will see a particular thread using more memory thant the others in the same process ……
Paul,
SWAP is not always a good indicator of RAM exhaustion. Remember that swap is also used for COW pages (Copy On Write) …… a crude example would be things like DB doing interprocess communications … even vi does this. The typical indication of RAM exhaustion is when you see a lot of I/O wait and so/bo when running vmstat 5 ….
top is a great utility to get a quick realtime look at what is going on but, you also need other tools to get the full picture 🙂
Leslie Satenstein
Einer,
Thank you all for the feedback. Putting your suggestions together with Yury and with Diego,
I will workout a measuring plan.
svsv sarma
Thank you. Throws a light on TOP utility and memory usage. Now I am happy to see that my note book has memory 4GB enough and to spare and SWAP is used rarely. This I can see with System Monitor/Resources also. However TOP takes a special study.
Gudrun Khom
Werde ich da grad verapplet — Ich will dass das Programm funktioniert und mich auf Deutsch unterhalten …
Paul W. Frields
If you want Fedora to work in German, use the Region and Language settings to add support for German language. Note that when you installed, you were asked to select the language as the first step. For further help, please consult the help page here, since the Magazine is not a support forum: https://fedoraproject.org/wiki/Communicating_and_getting_help
alex
Thank you Einer for the clarification , i did not know that 🙂
John Lukas
sar command and sar graph is a nice tool to gather memory info.
$ sudo sar -r 1 3
Refer : https://linoxide.com/linux-command/system-performance-monitoring-sar-command/
Dan Marinescu
generally, when one presents a set of concepts, does not use undefined terms. apparently, no such case here. you are using resident memory without explaining what it is.