Infrastructure monitoring is an integral part of infrastructure management. It is an IT manager's first line of defense against surprise downtime. Severe issues can inject considerable downtime to live infrastructure, sometimes causing heavy loss of money and material.
Monitoring collects time-series data from your infrastructure so it can be analyzed to predict upcoming issues with the infrastructure and its underlying components. This gives the IT manager or support staff time to prepare and apply a resolution before a problem occurs.
A good monitoring system provides:
- Measurement of the infrastructure's performance over time
- Node-level analysis and alerts
- Network-level analysis and alerts
- Downtime analysis and alerts
- Answers to the 5 W's of incident management and root cause analysis (RCA):
- What was the actual issue?
- When did it happen?
- Why did it happen?
- What was the downtime?
- What needs to be done to avoid it in the future?
Building a strong monitoring system
There are a number of tools available that can build a viable and strong monitoring system. The only decision to make is which to use; your answer lies in what you want to achieve with monitoring as well as various financial and business factors you must consider.
While some monitoring tools are proprietary, many open source tools, either unmanaged or community-managed software, will do the job even better than the closed source options.
In this article, I will focus on open source tools and how to use them to create a strong monitoring architecture.
Log collection and analysis
To say "logs are helpful" would be an understatement. Logs not only help in debugging issues; they also provide a lot of information to help you predict an upcoming issue. Logs are the first door to open when you encounter issues with software components.
Both Fluentd and Logstash can be used for log collection; the only reason I would choose Fluentd over Logstash is because of its independence from the Java process; it is written in C+ Ruby, which is widely supported by container runtimes like Docker and orchestration tools like Kubernetes.
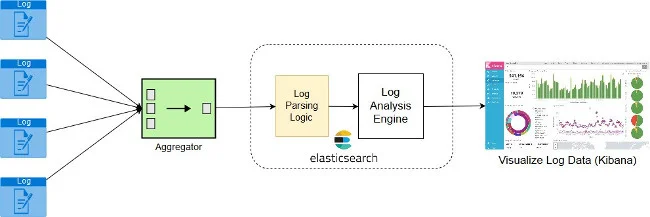
Log analytics is the process of analyzing the log data you collect over time and producing real-time logging metrics. Elasticsearch is a powerful tool that can do just that.
Finally, you need a tool that can collect logging metrics and enable you to visualize the log trends using charts and graphs that are easy to understand. Kibana is my favorite option for that purpose.

Because logs can hold sensitive information, here are a few security pointers to remember:
- Always transport logs over a secure connection.
- The logging/monitoring infrastructure should be implemented inside the restricted subnet.
- Access to monitoring user interfaces (e.g., Kibana and Grafana) should be restricted or authenticated only to stakeholders.
Node-level metrics
Not everything is logged!
Yes, you heard that right: Logging monitors a software or a process, not every component in the infrastructure.
Operating system disks, externally mounted data disks, Elastic Block Store, CPU, I/O, network packets, inbound and outbound connections, physical memory, virtual memory, buffer space, and queues are some of the major components that rarely appear in logs unless something fails for them.
So, how could you collect this data?
Prometheus is one answer. You just need to install software-specific exporters on the virtual machine nodes and configure Prometheus to collect time-based data from those unattended components. Grafana uses the data Prometheus collects to provide a live visual representation of your node's current status.
If you are looking for a simpler solution to collect time-series metrics, consider Metricbeat, Elastic.io's in-house open source tool, which can be used with Kibana to replace Prometheus and Grafana.
Alerts and notifications
You can't take advantage of monitoring without alerts and notifications. Unless stakeholders—no matter where they are in this big, big world—receive a notification about an issue, there's no way they can analyze and fix the issue, prevent the customer from being impacted, and avoid it in the future.
Prometheus, with predefined alerting rules using its in-house Alertmanager and Grafana, can send alerts based on configured rules. Sensu and Nagios are other open source tools that offer alerting and monitoring services.
The only problem people have with open source alerting tools is that the configuration time and the process sometimes seem hard, but once they are set up, these tools function better than proprietary alternatives.
However, open source tools' biggest advantage is that we have control over their behavior.
Monitoring workflow and architecture
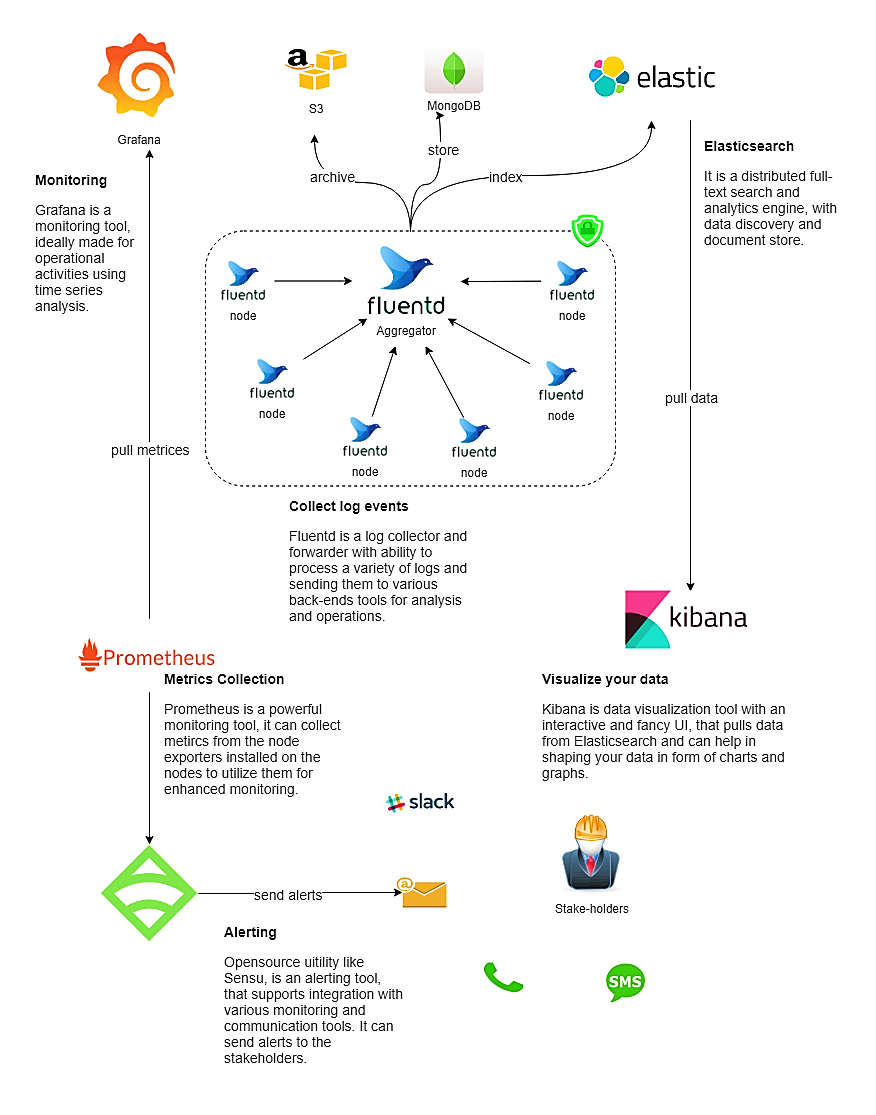
A good monitoring architecture is the backbone of a strong and stable monitoring system. It might look something like this diagram.

In the end, you must choose a tool based on your needs and infrastructure. The open source tools discussed in this article are used by many organizations for monitoring their infrastructure and blessing it with high uptime.
This article was adapted from a post on Medium.com's Hacker Noon and is republished here with the author's permission.


Comments are closed.