
The top command is the most important and useful tool for system admin; it used to monitor system resources and processes on Linux operating system.
The top command tool is pre-installed for all Linux system. It allows users for a dynamic and real-time view of the process and resource utilization on Linux.
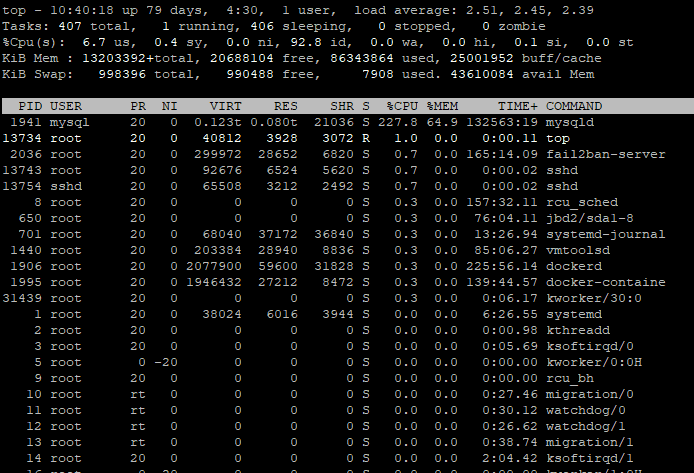
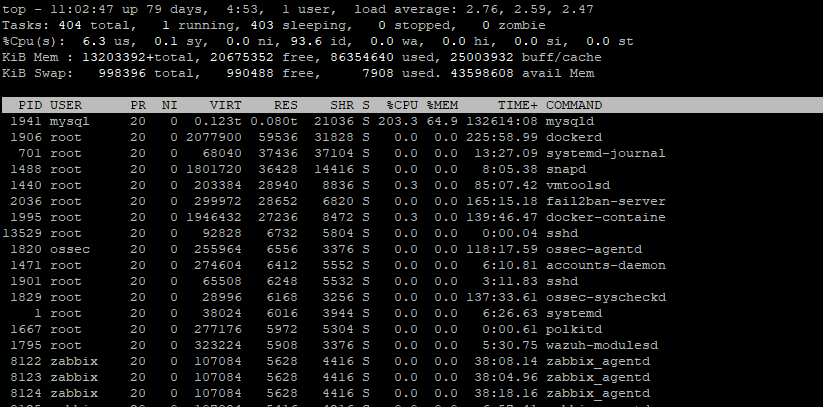
The top command is an interactive command-line application; it displays output in two-part of the screen. The first half of the screen show statistics on process and resource and the second half shows a list of currently running processes. You can check the process using up-down arrow key and use ‘q’ key for quit from the top screen.
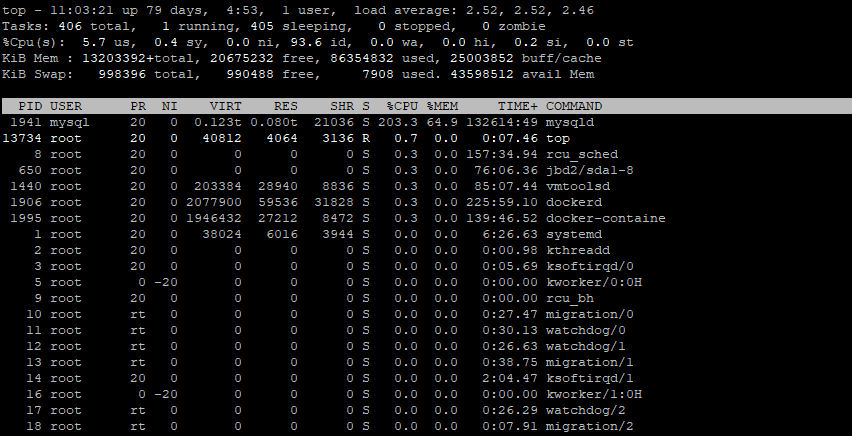
The top command output looks like below image.
There is a various number of top variants available; you can check using ‘top –v’ command the most common top is coming with the ‘procps-ng’ package.
$ top –vUnderstanding the top interface
As already explained, top command output shows in two-part of the screen. The upper part of the screen shows the summary of the process and system resources status; it is also called a “summary area.”
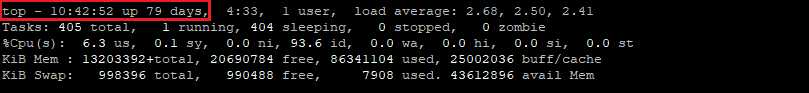
System time, uptime and user sessions
The first line of output shows the system uptime and system time with user sessions, as shown the below image.
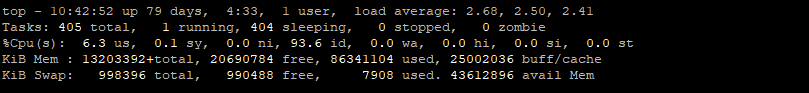
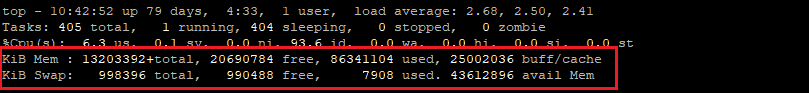
Memory usage
The last two lines of the first part or summary area of top command showing all information about system memory, like total available memory, used memory or free memory, etc., which you can see in below image.
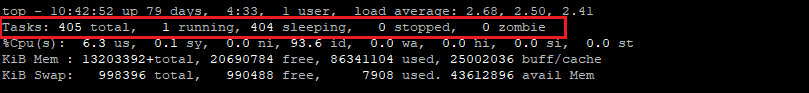
Tasks
The tasks information in top command shows information about the entire process like the whole process, current running process numbers, total sleeping process, total stopped processes, and the total number of zombie process, etc., as shown below.
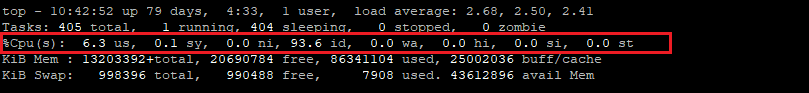
CPU usage
The CPU usage displays information about CPU time spent on various tasks. The ‘us’ value is the time represent the CPU spends executing processes in userspace, and ’sy’ value is showing the spent time on running kernel space processes.
The ‘ni’ value shows the time spent on executing processes with a manually set ‘nice’ and the ‘id’ value represent the time for CPU remains idle.
The ‘wa’ value is representing the time CPU spends for waiting for I/O to complete and the time spent on handling software and hardware interrupts are represented by ‘hi’ and ‘si’ respectively.
A part of CPU resources given to the virtual machine, and the OS detects when it has work to do, but it can’t perform them because CPU is busy on other virtual machines. The ‘st’ representing the time which lost in this way.
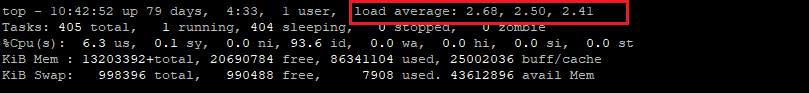
Load average
You can also check the system load into the load average section, which represents the average load on one, five, and fifteen minutes. This load used to measure the amount of computational work on system performs. In the Linux operating system, the load is the number of processes in R and D states and the “load average” value gives you the measure of time to how long you must wait for work to get done.
Understanding the task area
The second part of the top command shown all running tasks on the operating system. It displays information about the process in the various column.
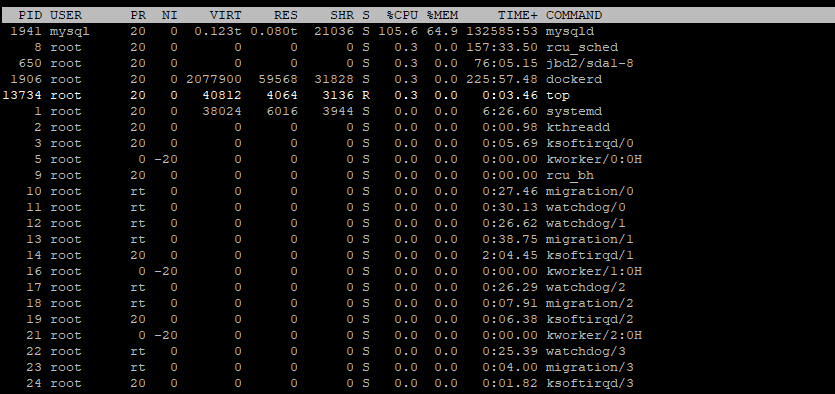
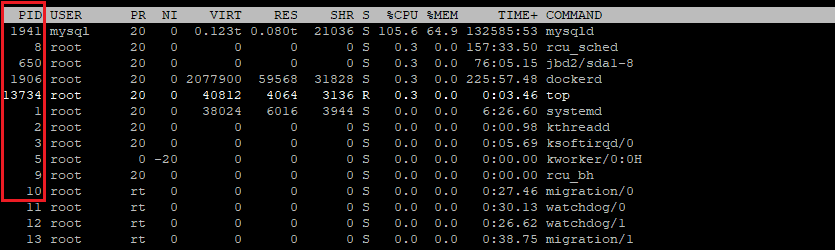
PID
This column displays unique positive integer use to identify process called a process ID.
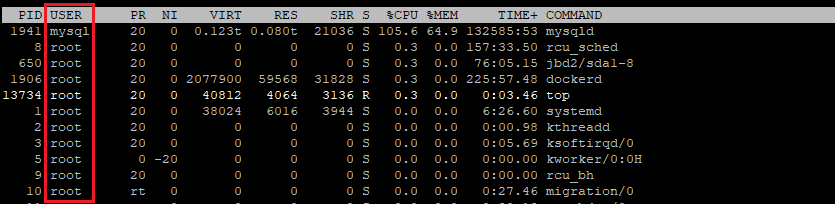
USER
In this column shows the username. In the Linux operating system, all process is has assigned a User ID and allows a process to act on behalf of another user.
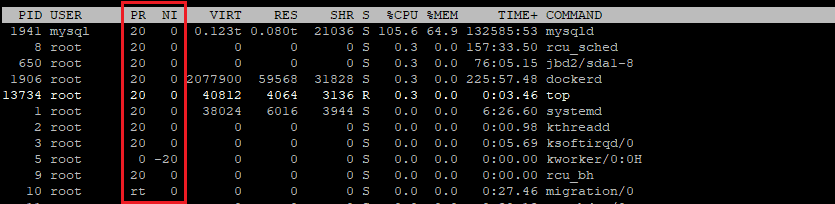
PR and NI
The ‘PR’ column shows the priority of the process, and ‘NI’ column shows the ‘nice’ value of the process.
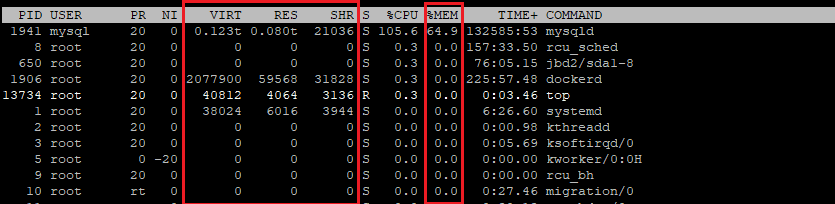
VIRT, RES, SHR and %MEM
The ‘VIRT’ column shows the total memory consumed by the process and the ‘RES’ is the memory consumed by the process in RAM, ‘SHR’ is the memory shared with other process and ‘%MEM’ expresses this value as a percentage of the total RAM available.
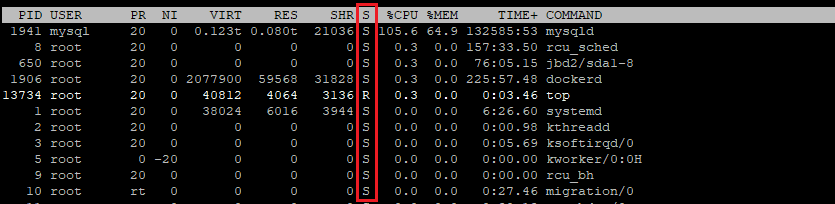
S
The ‘S’ column shows the status of the process.
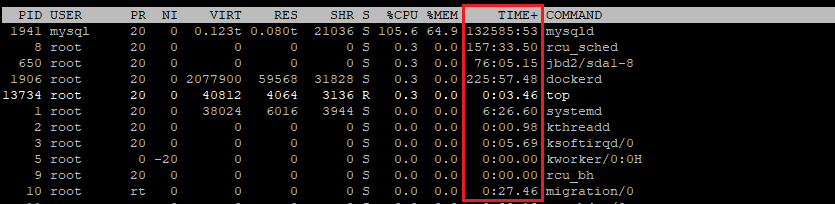
TIME+
The ‘TIME+’ column shows the total CPU time used by the process since it started.
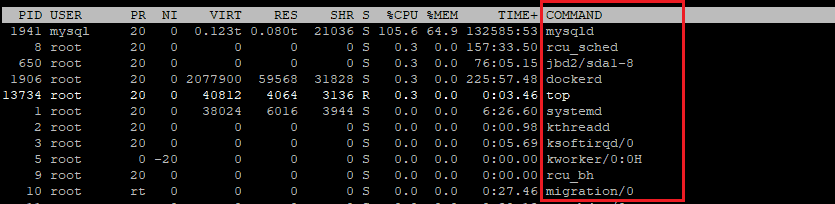
COMMAND
The ‘COMMAND’ column shows the name of the processes.
Top command usage examples
Example 1: Sorting the process list
Sorting the process list is the most common task when we are running the ‘top’ command. We always wanted to know which process is consuming most of the CPU resources or memory utilization, etc., in this case, it is beneficial to sort the process list as per the requirements.
You can use the following option to sort the process list while running the ‘top’ command:
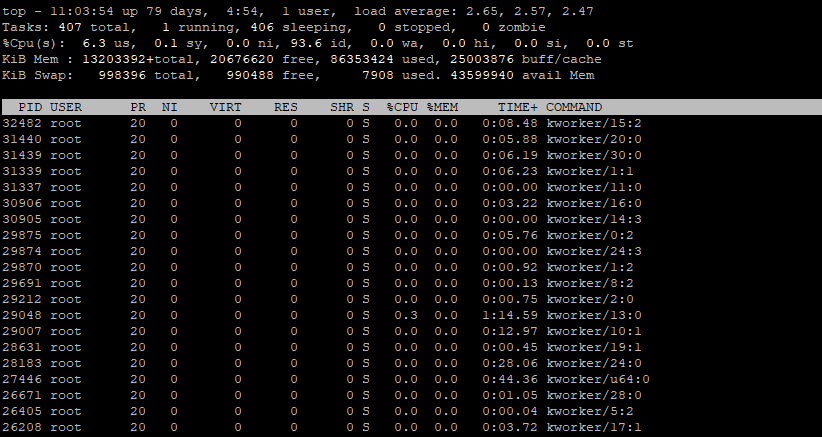
• ‘M’ is use to sort process list on memory usage
• ‘P’ is use to sort process list on CPU utilization
• ‘N’ is use to sort the process list by process ID
• ‘T’ is use to sort the process list on running time
In default top sort in descending order but you can rearrange it in ascending order by pressing ‘R’ key.
Example 2: Listing process from specific user
Press ‘u’ key while running top command and type the username to display all process of that user or leave blank to display process for all users.
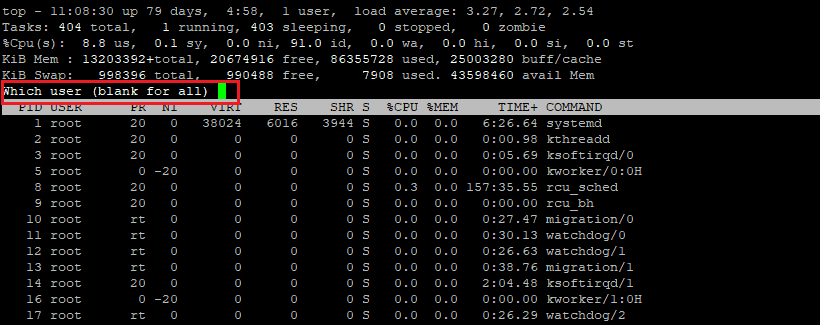
You can also use ‘-u’ option with the ‘top’ command to display the all process of the specific user when you start the top command, as shown below:
$ top –u rootExample 3: Killing the process
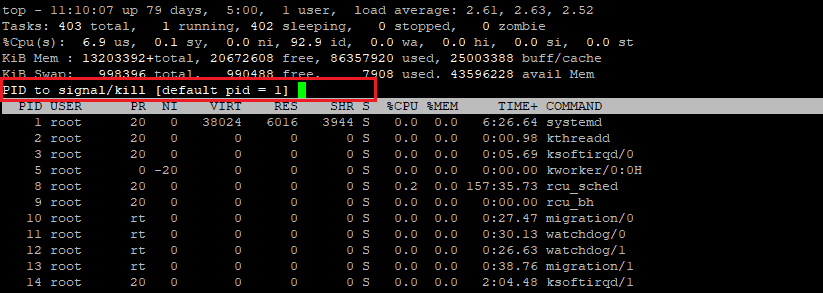
If you want to kill the process while running the ‘top’ command, you can press ‘k’ and enter the process ID which you want to kill and press ‘enter’ button, as shown below.
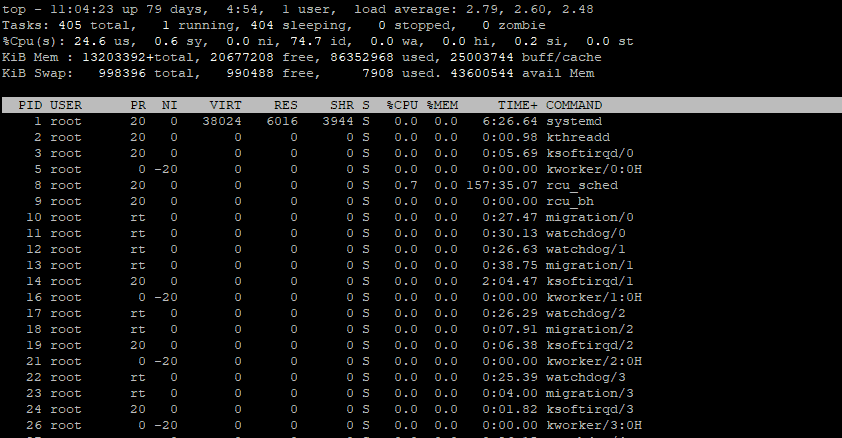
One of the flags I use is to press the “1” key in top.
This shows all the cores of the CPU individually and their utilization.
Useful on today’s multi core systems to see if a process is using 100% of a thread or how work is sptead to multiple cores.