How to Install and Use Perf Performance Analysis Tool on CentOS 8
On this page
Perf is a performance analyzing tool in Linux operating systems. It comes with a number of subcommands and capable of statistical profiling of the entire system. It supports tracepoints, software performance counters, hardware performance counters and dynamic probes. It also helps you solve advanced performance and troubleshooting functions.
In this tutorial, we will show you how to install and use perf performance analyzing tool on CentOS 8.
Prerequisites
- A server running CentOS 8.
- A root password is setup on your server.
Install Perf
By default, the Perf package is available in the CentOS 8 default repository. You can install it by simply running the following command:
dnf install perf -y
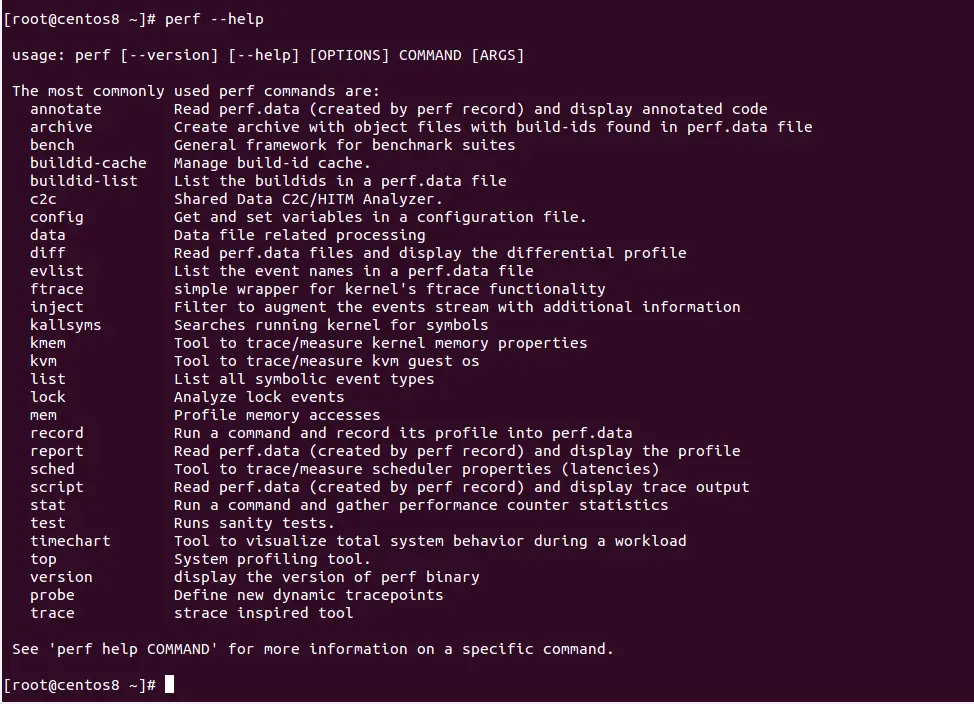
Once install, you can list all subcommands available with Perf using the following command:
perf --help
You should see the following screen:
Perf Stat
This sub-command runs a command and collects Linux performance statistics from it.
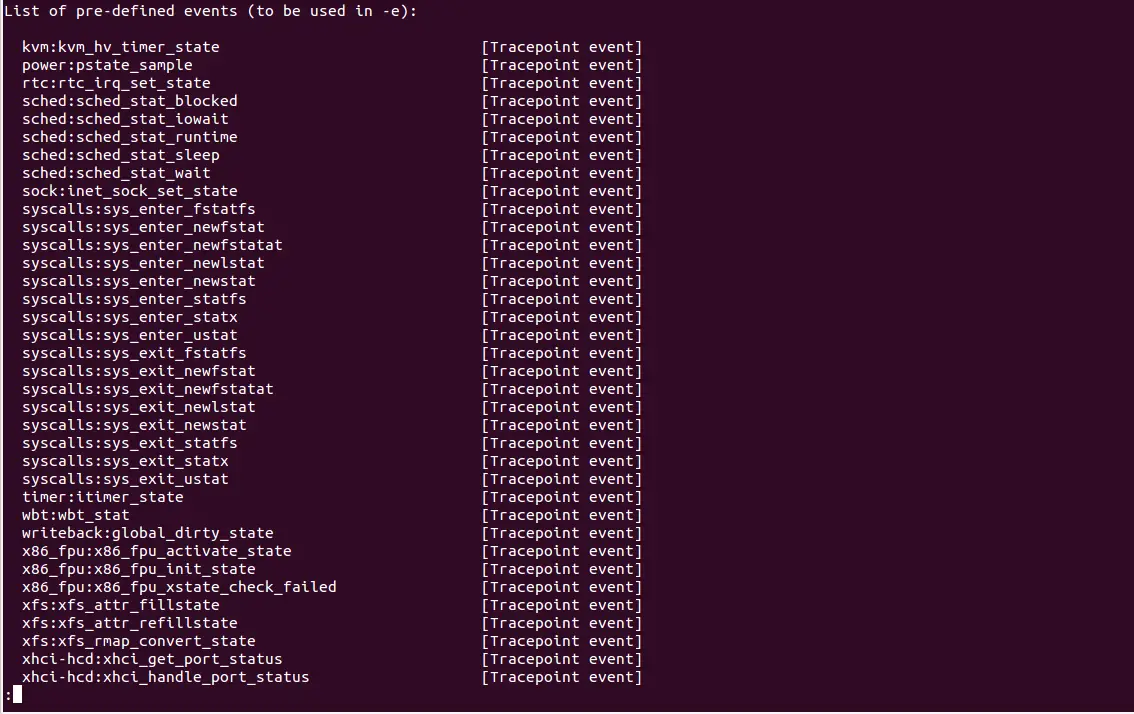
You can display the list of software pre-defined events in Linux using the following command:
perf list stat
You should see the following screen:
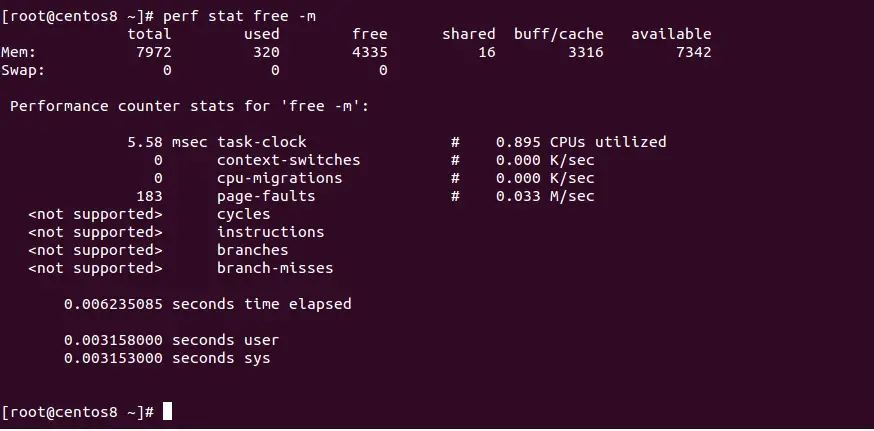
If you want to know what happens in our system when we run "free -m" command, use the following command:
perf stat free -m
You should see the performance statistics of free -m command in the following screen:
Perf Top
perf-top is a system profiling tool used to generates and displays a performance counter profile in real-time.
You can use perf top with -a option to see all of the known event types:
perf top -a
You should see the following screen:
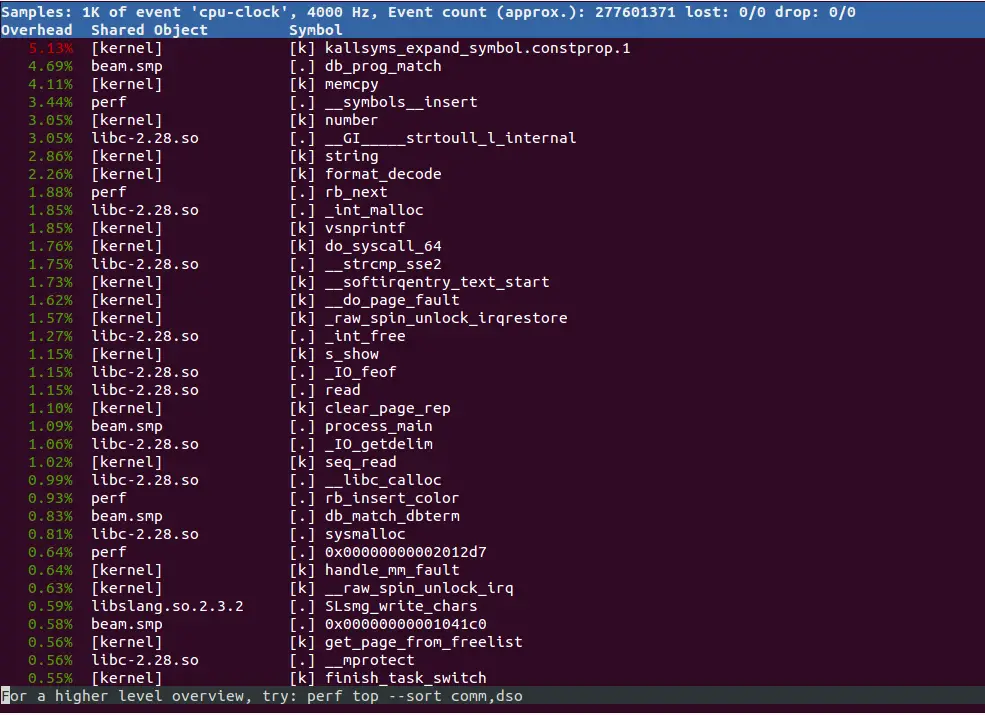
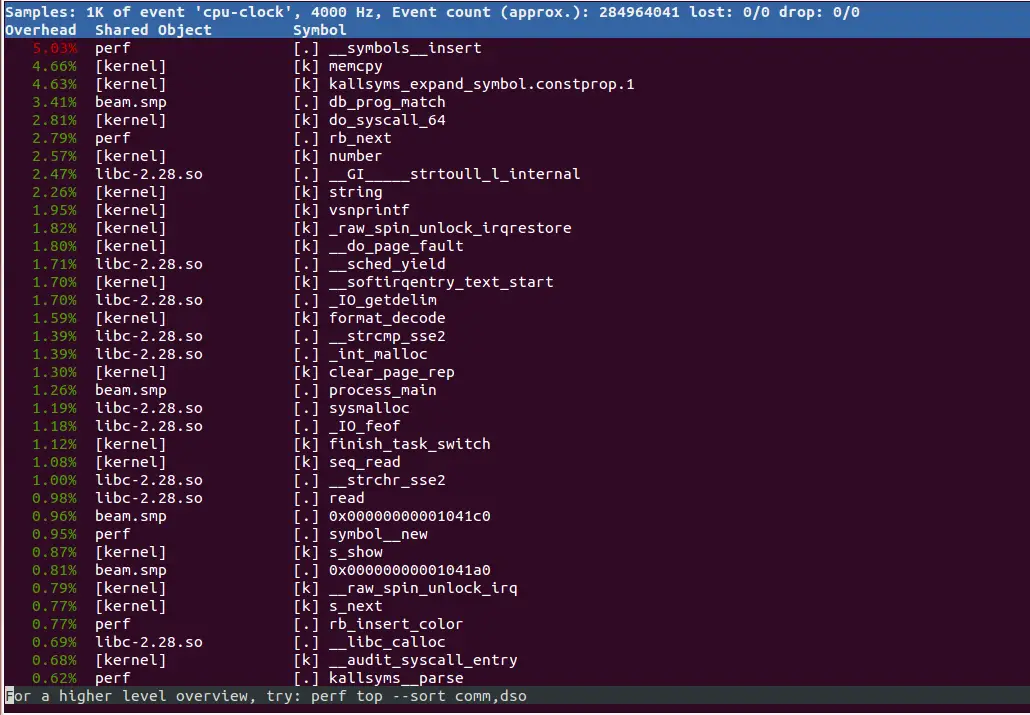
You can also use -e option to display cpu-clock related events:
perf top -e cpu-clock
You should see the following screen:
Perf Record
perf-record run a command and record its profile into perf.data inside the current working directory.
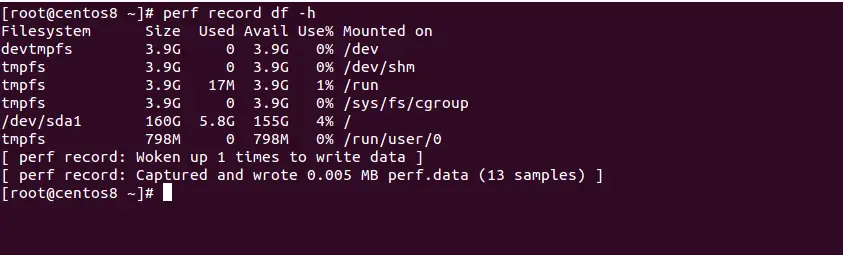
For example, run a command "df -h" and record its profile into perf.data using the below command:
perf record df -h
You should see the following screen:
Perf Report
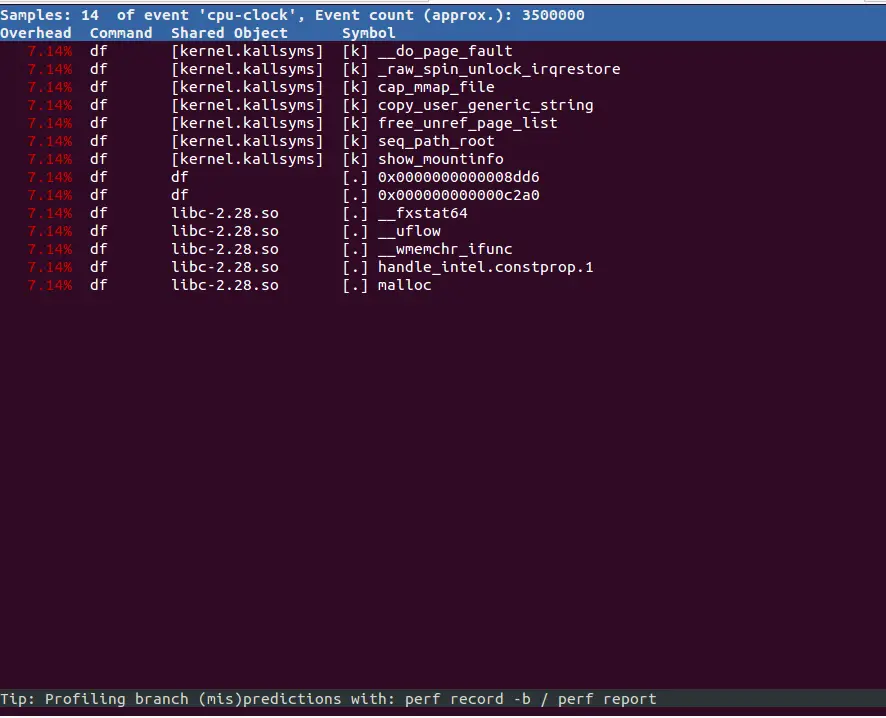
This command will analyze file generated by perf record and generate flat or graph profile.
perf report
You should see the following screen:
Conclusion
In the above guide, we learned how to install and use the Perf performance monitoring tool on CentOS 8 system. I hope you have now enough knowledge of how to use perf to get the performance data of your system. For more information, visit the Perf documentation page.

