How to Install Logstash Logfile Analytics Software on Ubuntu 20.04
This tutorial exists for these OS versions
- Ubuntu 20.04 (Focal Fossa)
- Ubuntu 18.04 (Bionic Beaver)
On this page
ELK is a combination of three open-source products ElasticSearch, Logstash and Kibana. It is one of the most popular log management platform around the globe. Elasticsearch is a search and analytics engine. Logstash is a logs processing pipeline that transport logs from multiple sources simultaneously, transforms it, and then sends it to a “stash” like Elasticsearch. Kibana is used to visualize your data that Logstash has indexed into the Elasticsearch index
In this tutorial we will explain how to install Logstash on Ubuntu 20.04.
Prerequisites
- A server running Ubuntu 20.04.
- A root password is configured on the server.
Install Required Dependencies
In order to install Elasticsearch, you will need to install Java in your system. You can install the Java JDK with the following command:
apt-get install openjdk-11-jdk -y
Once installed, verify the installed version of java with the following command:
java -version
You should see the following output:
openjdk 11.0.7 2020-04-14
OpenJDK Runtime Environment (build 11.0.7+10-post-Ubuntu-3ubuntu1)
OpenJDK 64-Bit Server VM (build 11.0.7+10-post-Ubuntu-3ubuntu1, mixed mode, sharing)
Next, install other required dependencies by running the following command:
apt-get install nginx curl gnupg2 wget -y
Once all the dependencies are installed, you can proceed to the next step.
Install and Configure Elasticsearch
before starting, you will need to install Elasticsearch in your system. It stores logs and events from Logstash and offers an ability to search the logs in a real-time.
First, add the Elastic repository to your system with the following command:
curl -fsSL https://artifacts.elastic.co/GPG-KEY-elasticsearch | apt-key add -
echo "deb https://artifacts.elastic.co/packages/7.x/apt stable main" | tee -a /etc/apt/sources.list.d/elastic-7.x.list
Next, update the repository and install the Elasticsearch with the following command:
apt-get update -y
apt-get install elasticsearch -y
Once installed, edit the Elasticsearch default configuration file:
nano /etc/elasticsearch/elasticsearch.yml
Uncomment and change its value as shown below:
network.host: localhost
Save and close the file then start the Elasticsearch service and enable it to start at boot with the following command:
systemctl start elasticsearch
systemctl enable elasticsearch
At this point, Elasticsearch is installed and listening on port 9200. You can now test whether Elasticsearch is working or not by running the following command:
curl -X GET "localhost:9200"
If everything is fine you should see the following output:
{
  "name" : "ubuntu2004",
  "cluster_name" : "elasticsearch",
  "cluster_uuid" : "AVRzLjAbQTK-ayYQc0GaMA",
  "version" : {
    "number" : "7.8.0",
    "build_flavor" : "default",
    "build_type" : "deb",
    "build_hash" : "757314695644ea9a1dc2fecd26d1a43856725e65",
    "build_date" : "2020-06-14T19:35:50.234439Z",
    "build_snapshot" : false,
    "lucene_version" : "8.5.1",
    "minimum_wire_compatibility_version" : "6.8.0",
    "minimum_index_compatibility_version" : "6.0.0-beta1"
  },
  "tagline" : "You Know, for Search"
}
Once you are finished, you can proceed to the next step.
Install and Configure Kibana
Next, you will need to install Kibana in your system. Kibana enables you to analyze data stored on Elasticsearch. You can install it by just running the following command:
apt-get install kibana -y
Once the Kibana has been installed, start the Kibana service and enable it to start at boot with the following command:
systemctl start kibana
systemctl enable kibana
Next, you will need to create an administrative user for Kibana to access the Kibana web interface. Run the following command to create the administrative Kibana user and password, and store them in the htpasswd.users file.
echo "admin:`openssl passwd -apr1`" | tee -a /etc/nginx/htpasswd.users
You will be asked to provide password as shown in the following output:
Password:
Verifying - Password:
admin:$apr1$8d05.YO1$E0Q8QjfNxxxPtD.unmDs7/
Next, create an Nginx virtual host configuration file to serve the Kibana:
nano /etc/nginx/sites-available/kibana
Add the following lines:
server {
    listen 80;

    server_name kibana.example.com;

    auth_basic "Restricted Access";
    auth_basic_user_file /etc/nginx/htpasswd.users;

    location / {
        proxy_pass http://localhost:5601;
        proxy_http_version 1.1;
        proxy_set_header Upgrade $http_upgrade;
        proxy_set_header Connection 'upgrade';
        proxy_set_header Host $host;
        proxy_cache_bypass $http_upgrade;
    }
}
Save and close the file then enable the Nginx virtual host file with the following command:
ln -s /etc/nginx/sites-available/kibana /etc/nginx/sites-enabled/
Next, restart the Nginx service to apply the changes:
systemctl restart nginx
Next, open your web browser and check the status of the Kibana using the URL http://kibana.example.com/status. You will be asked to provide username and password as shown below:
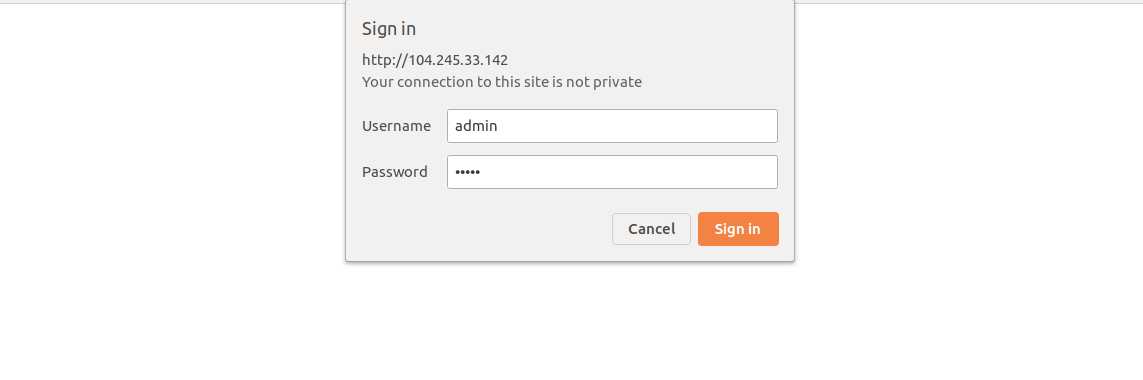
Provide your Kibana username and password, and click on the Sign in button. You should see the following screen:
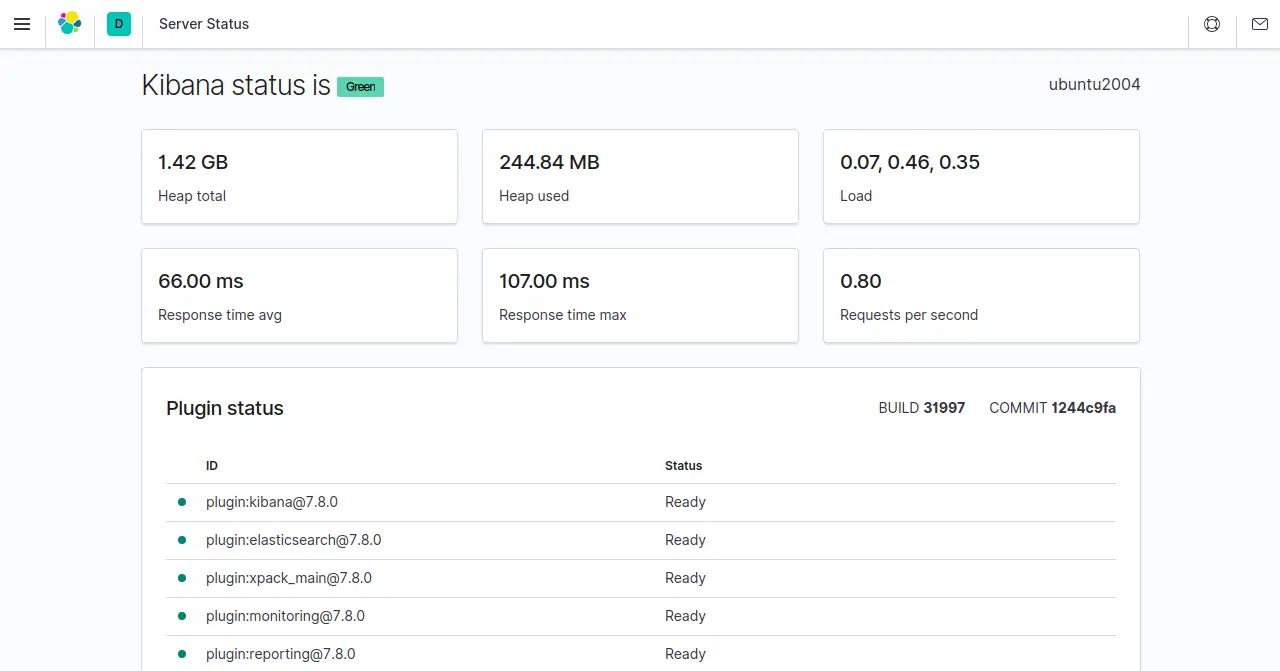
At this point, Kibana dashboard is installed in your system. You can now proceed to the next step.
Install and Configure Logstash
Logstash is used for processing of logs sent by beats. You can install it by running the following command:
apt-get install logstash -y
Once Logstash has been installed, create a new beat configuration file with the following command:
nano /etc/logstash/conf.d/02-beats-input.conf
Add the following lines:
input {
  beats {
    port => 5044
  }
}
Save and close the file then create an Elasticsearch configuration file with the following command:
nano /etc/logstash/conf.d/30-elasticsearch-output.conf
Add the following lines:
output {
  if [@metadata][pipeline] {
    elasticsearch {
    hosts => ["localhost:9200"]
    manage_template => false
    index => "%{[@metadata][beat]}-%{[@metadata][version]}-%{+YYYY.MM.dd}"
    pipeline => "%{[@metadata][pipeline]}"
    }
  } else {
    elasticsearch {
    hosts => ["localhost:9200"]
    manage_template => false
    index => "%{[@metadata][beat]}-%{[@metadata][version]}-%{+YYYY.MM.dd}"
    }
  }
}
Save and close the file then verify your Logstash configuration with this command:
sudo -u logstash /usr/share/logstash/bin/logstash --path.settings /etc/logstash -t
If everything is fine, you should see the following output:
Config Validation Result: OK. Exiting Logstash
Next, start the Logstash service and enable it to start at boot with the following command:
systemctl start logstash
systemctl enable logstash
At this point, Logstash is installed in your system. You can now proceed to the next step.
Install and Configure Filebeat
ELK stack uses Filebeat to collect data from various sources and transport them to Logstash.
You can install Filebeat with the following command:
apt-get install filebeat -y
Once installed, you will need to configure Filebeat to connect to Logstash. You can configure it with the following command:
nano /etc/filebeat/filebeat.yml
Comment out the following lines:
#output.elasticsearch:
  # Array of hosts to connect to.
#  hosts: ["localhost:9200"]
Then, uncomment the following lines:
output.logstash:
  # The Logstash hosts
  hosts: ["localhost:5044"]
Save and close the file then enable the system module with the following command:
filebeat modules enable system
By default, Filebeat is configured to use default paths for the syslog and authorization logs.
You can load the ingest pipeline for the system module with the following command:
filebeat setup --pipelines --modules system
Next, load the template with the following command:
filebeat setup --index-management -E output.logstash.enabled=false -E 'output.elasticsearch.hosts=["localhost:9200"]'
You should see the following output:
Index setup finished.
By default, Filebeat comes packaged with sample Kibana dashboards that allow you to visualize Filebeat data in Kibana. So you need to disable the Logstash output and enable Elasticsearch output. You can do it with the following command:
filebeat setup -E output.logstash.enabled=false -E output.elasticsearch.hosts=['localhost:9200'] -E setup.kibana.host=localhost:5601
You should see the following output:
Overwriting ILM policy is disabled. Set `setup.ilm.overwrite:true` for enabling.

Index setup finished.
Loading dashboards (Kibana must be running and reachable)
Loaded dashboards
Setting up ML using setup --machine-learning is going to be removed in 8.0.0. Please use the ML app instead.
See more: https://www.elastic.co/guide/en/elastic-stack-overview/current/xpack-ml.html
Loaded machine learning job configurations
Loaded Ingest pipelines
Now, start the Filebeat service and enable it to start at boot with the following command:
systemctl start filebeat
systemctl enable filebeat
Access Kibana Dashboard
At this point, all components of ELK are installed and configured. Now, open your web browser and type the URL http://kibana.example.com. You should see the Kibana dashboard in the following screen:
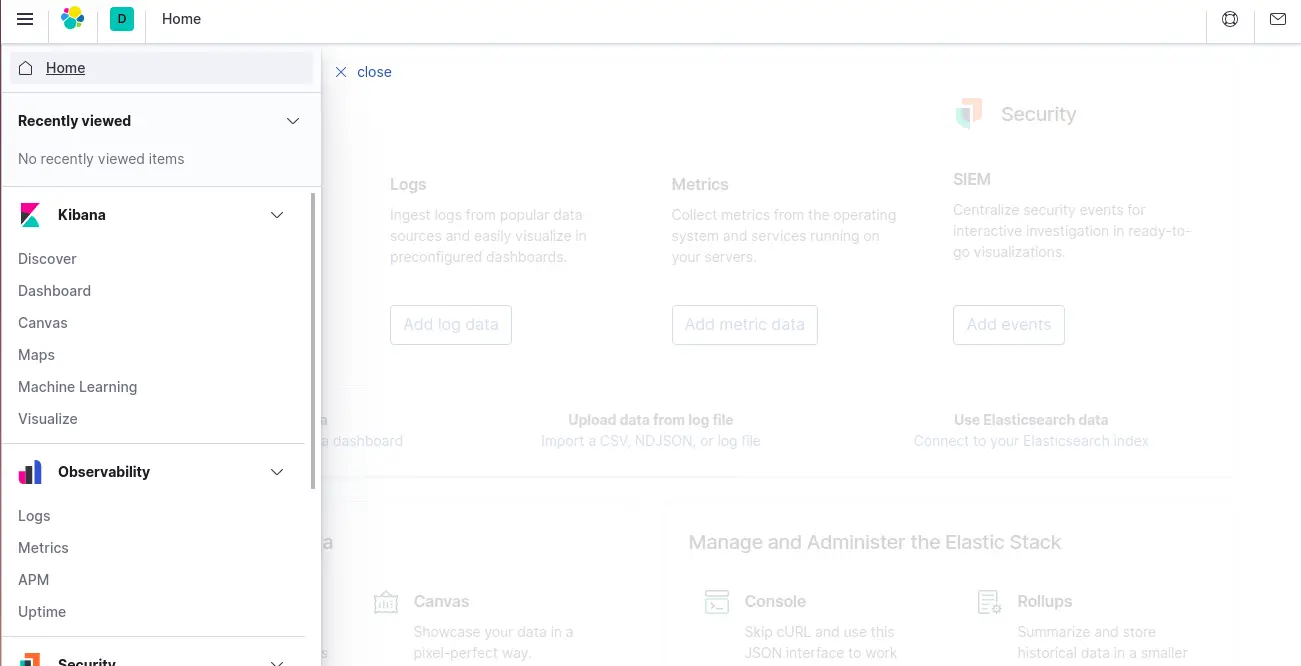
In the left-pane, click on the Discover and select the predefined filebeat-* index pattern to see Filebeat data in the following screen:
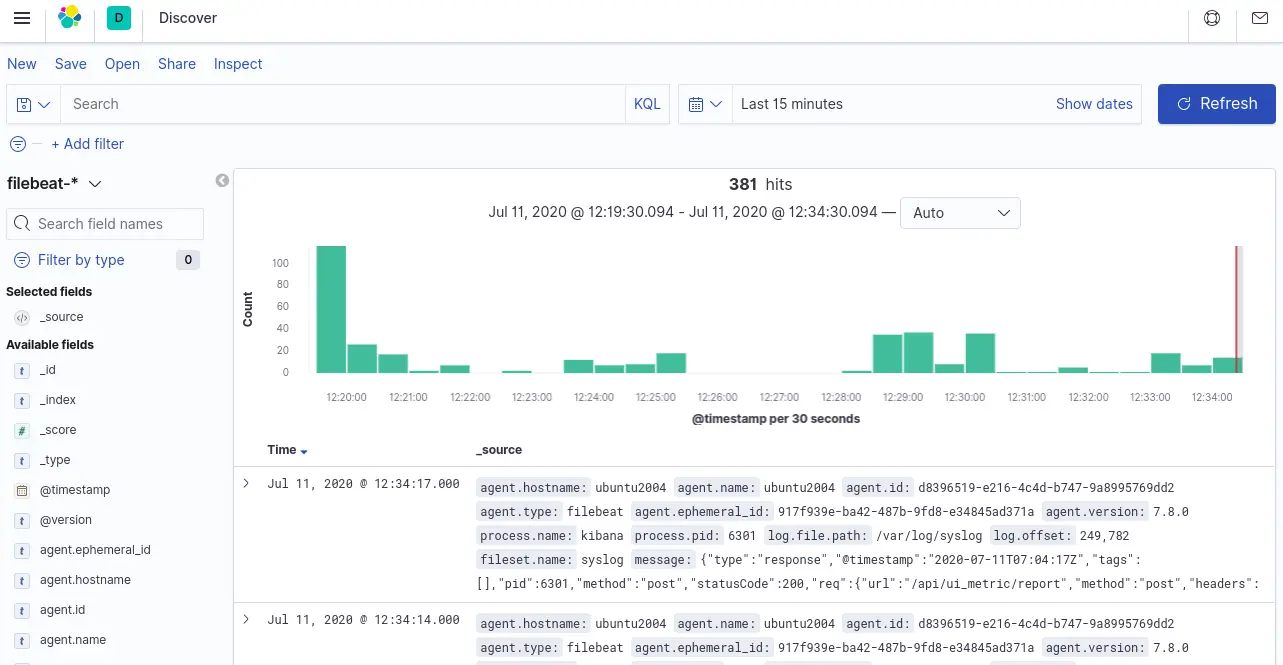
Now, Kibana offers a lot of features. Feel free to explore them as you wish.
Conclusion
Congratulations! you have successfully installed and configure Logstash on Ubuntu 20.04 server. You can now collect and analyze system logs from a central location. Feel free to ask me if you have any questions.

