Debugging Python code, for many of us, comes down to adding print statements and trying to reason what’s going on based on the output. It’s not ideal, but for some reason, people just don’t want to touch the Python debugger.
Table of Contents
Using print to debug code
If you’re one of those people that use print for debugging, I’m not judging you. Learning Python is hard. Programming is hard. Life is hard. I understand that learning yet another thing seems tiresome if you’re struggling already. And adding that print statement to your code… it’s just easier. A little confession: I still do it all the time as well. It’s not as bad as some make it seem.
For some reason, people just don’t want to touch the Python debugger
Me.
Having said that, I’m going to teach you a little trick that will be just as easy as adding print statements to your code. However, this trick gives you infinite debugging powers and will allow you to conquer the world, should you need to.
Setting a Python debugger breakpoint
You don’t need an IDE to debug your code properly. This trick always works, even in the simplest editor, and even in Jupyter Notebooks.
The trick comes down to this: setting a so-called breakpoint using the instruction breakpoint(). You can insert it in your code, no matter what editor or IDE you’re using, at the point where you would normally put in that pesky print statement.
So what happens when you do so? Let’s find out! Create a simple program, like the one below:
def add_two(x):
    return x + 2
for i in range(1, 10):
    a = add_two(i)
    breakpoint()
    print(a)
When you run this, and it doesn’t matter if you do so in the REPL, from the command-line, or in your IDE, you are dropped into the Python debugger called PDB. But now what?
Using the Python debugger
When I start the little program above, this is what happens:
$ python3 breakpointing.py
> /home/erik/breakpointing.py(7)<module>()
-> print(a)
(Pdb)_
There are a couple of things to see here:
- It shows the current file that was started (
breakpointing.py) - After that, it shows the next command that was about to run, but was interrupted by the call to
breakpoint(). - And finally, we see the pdb prompt, waiting for our input.
The Python debugger is actually a fully functioning Python shell, just like the REPL.
At this point, we can inspect the current environment. Let’s see what the value of a is right now:
(Pdb) print(a)
3
(Pdb) print(i)
1
Instead of print, you can also use the pdb specific command p, like this:
(Pdb) p a
3
(Pdb_ p i
1
Running the next line
So what if we want to run the next line of code? There are two options:
- With
sorstep, you execute the current line. The debugger stops at the first possible occasion after that. - With
nornext, you execute the current line as well but now the debugger keeps going until the next line of the current function is reached.
To make this more clear: step happily enters a function call and break inside that function. In contrast, next executes the function until it returns, and breaks on the next line.
Other debuggers and IDEs also call this ‘step into’ (instead of step) and ‘step over’ (instead of next).
Now let’s use these two:
$ python3 breakpointing.py
-> print(a)
(Pdb) s
3
-> for i in range(1, 10):
(Pdb) s
-> a = add_two(i)
(Pdb) n
-> breakpoint()
(Pdb) n
-> print(a)
(Pdb) n
4
-> for i in range(1, 10):
(Pdb) s
-> a = add_two(i)
(Pdb) s
--Call--
-> def add_two(x):
(Pdb) s
-> return x + 2
(Pdb) s
--Return--
5
-> return x + 2
(Pdb) s
-> breakpoint()
(Pdb)
As you can see, we first step over the call to add_two with n. The second time, we step into the function with s.
Python debugger commands
There are more commands that you can try on your own. I won’t list them all, just the most useful ones:
h(help): print all available commands. Also takes an argument, e.g.h ctells you what theccommand doesc(continue): start running until the next breakpointl(list): list the source code around the current linep: print the result of the following expression. You can use this instead of callingprint()pp: pretty print, useful for printing data structures like dictionaries- restart: restart the current program
For the complete documentation, head over to the Python debugger page, where all the commands are listed.
Keep learning
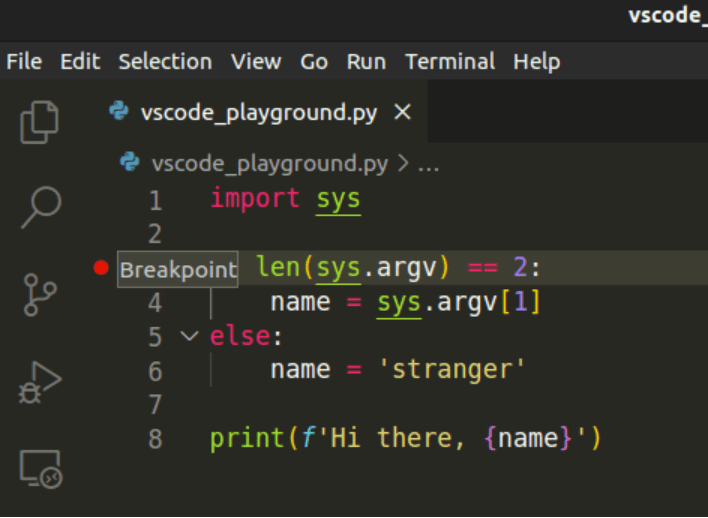
Although this can come in super handy, it pays to dive into the debugger that your IDE offers. If you’re a VSCode user, I wrote a tutorial on how to debug Python code in VSCode.