How to use Wireshark for capturing and analyzing network packets
Wireshark (formerly Ethereal) is a FOSS (free and open-source software) for network protocol analyzer. One can use it to troubleshoot network issues, analyze communication protocols like TCP, DNS, HTTP etc. There are many features that makes Wireshark stands apart from many of its counterparts:
- Real-time packet capture and offline analysis.
- Packet details in a human-readable format.
- Coloring rules for packets.
What will we cover?
In this guide, we will learn “How to use Wireshark for capturing and analyzing packets”. We are using Kali Linux as the base operating system for this guide. Let's get started now.
Capturing Packets with Wireshark
After launching the Wireshark, you will see a list of devices to capture packets from.
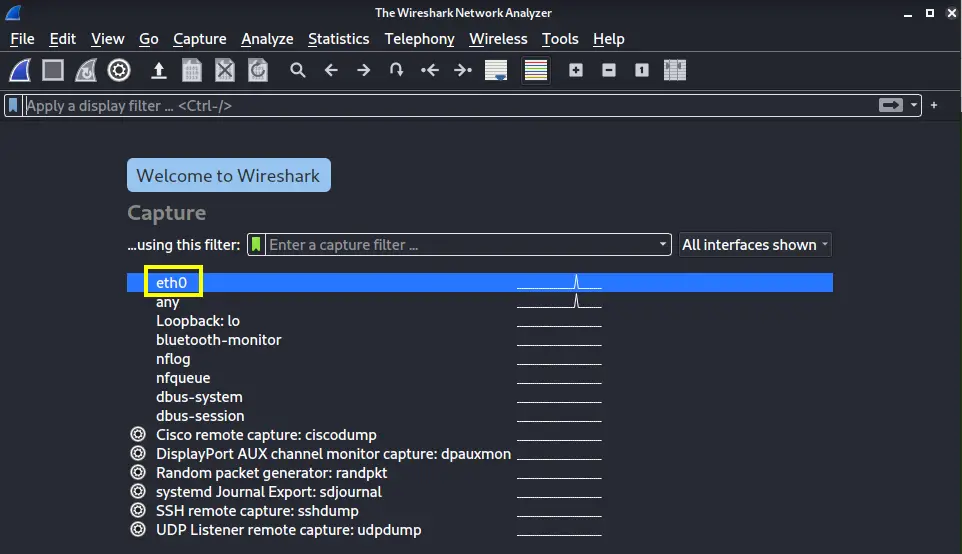
Select a device to start capturing packets by double-clicking its name. Let us select the interface ‘eth01’ in our case. As you can see after selecting the device, some packets start to appear on the screen.
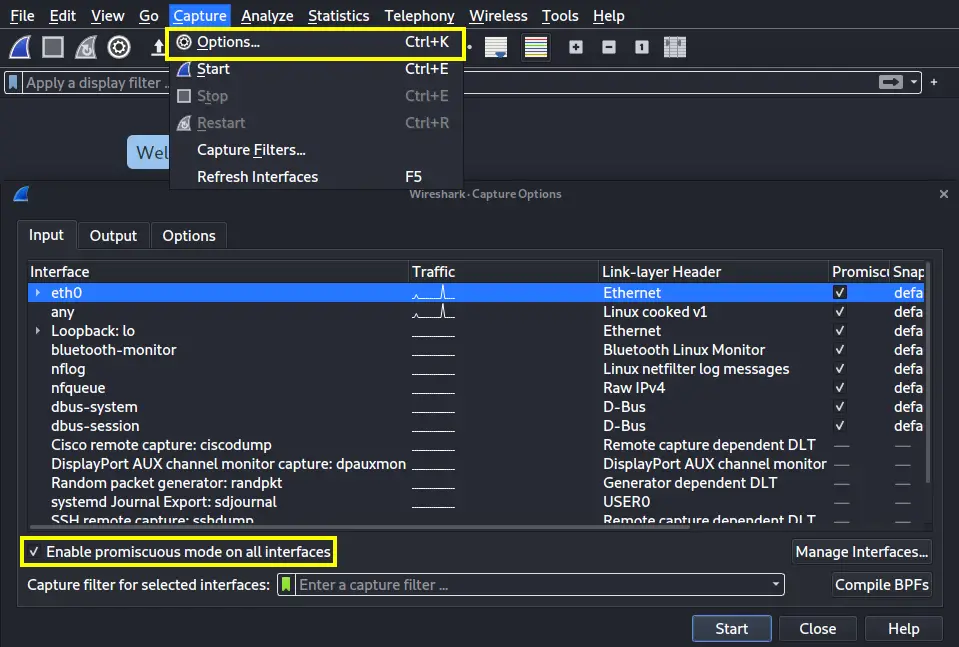
In promiscuous mode, Wireshark will also show packets other than those addressed to our network interface. This mode comes enabled by default, else you can go to 'Capture > Options' and mark the “Enable promiscuous mode on all interfaces” checkbox (at the bottom of the window).
To stop capturing the traffic, hit the red square icon on the top left side of the window. If you want to inspect your captures later, you can simply save them by clicking 'File > Save'. Similarly you can download capture files and open them to inspect by clicking ‘File > Open’. Locate your file and open it.
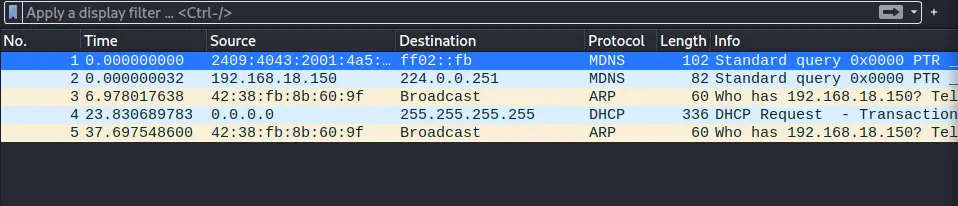
Wireshark’s Color Coding
Wireshark uses different color schemes to denote different types of traffic. For e.g. light blue color is used for UDP, purple for TCP and black for packets in errors. To see the meaning and modify these colors go to 'View > Coloring Rules'.
Packet Filtering with Wireshark
Wireshark has a filtering feature to filter out traffic specific to your interest. The easiest way to use this feature is to use the search bar located at the head of the packet list or the table depicting traffic summary as shown below. For e.g. if you want to filter the ‘TCP’ traffic, enter TCP in the search bar. We will see this process later in this tutorial.
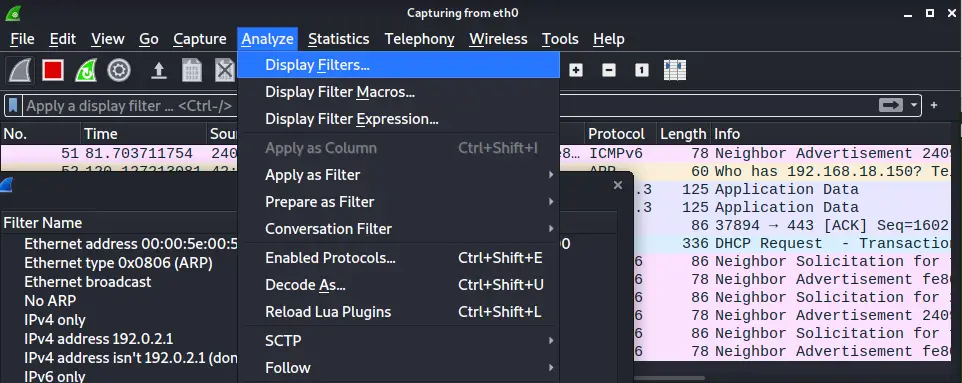
Wireshark also includes default filters in the section 'Analyze > Display Filters'. You can choose one from here and can also save your custom filters here for the future.
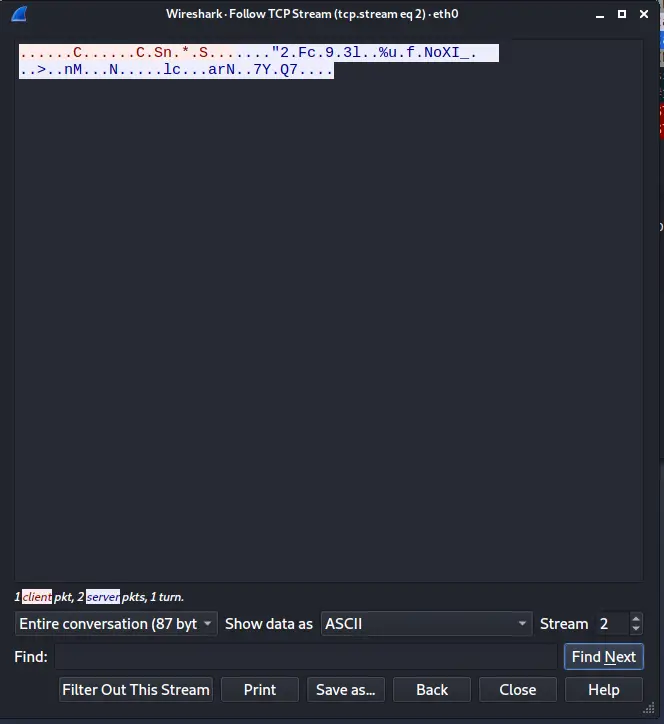
Besides filtering the traffic, you can also view the full TCP conversations between the client and the server. For this right-click a packet and hit ‘Follow > TCP Stream’ option. When you close this window, a filter will automatically appear in the filter search bar.
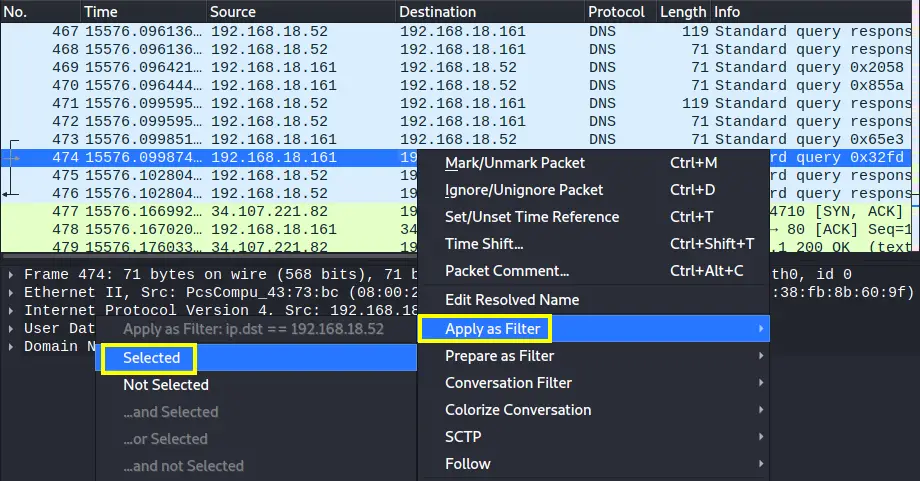
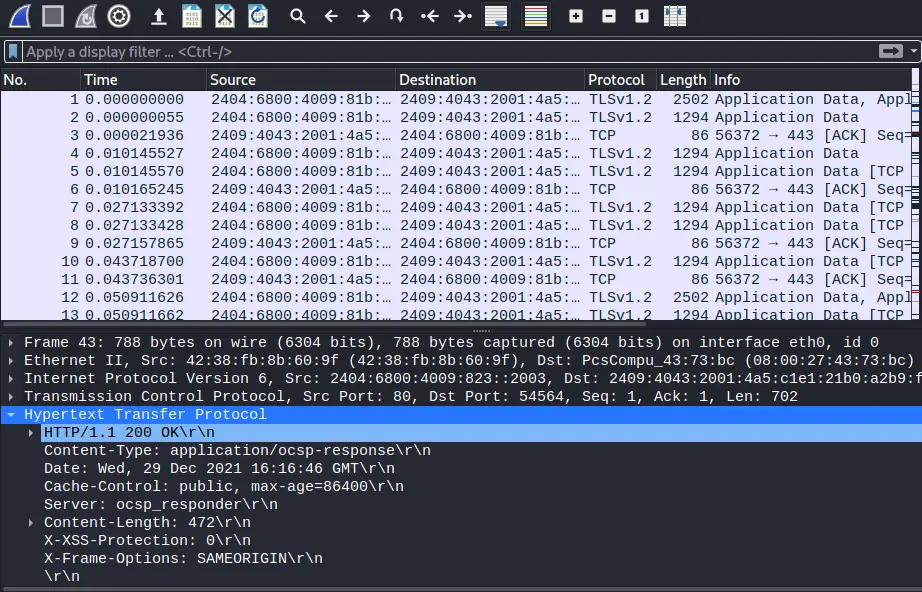
Packet Inspection with Wireshark
In the table depicting traffic summary, click on a packet to see its various details. Here is another way to create a custom filter. When you right click on any details, you will see the option ‘Apply as Filter’ and its submenu. Select any submenu to create that filter:
Wireshark Test Drive
Let us now take a practical example to capture and inspect traffic on a network interface using Wireshark. In our case we have installed Wireshark on Kali Linux and are interacting with the ethernet interface ‘eth0’. Now do the following steps:
1. After launching the Wireshark, select the interface from the device list on the start page. Click on the blue icon at the top left bar or double click the interface name to start the capture.
2. Now start a web browser and open a webpage like ‘www.howtoforge.com’. Once the page is loaded, stop the capture by pressing the red icon near the start button.
3. The capture window now has all the packets that were transferred from and to your system. Different types of traffic are shown in different color codes like blue, black, light yellow etc.
4. If you are looking for packets of a specific protocol like TCP, use the filter bar to filter those connections. There are many background processes running on a system which uses network access and thus exchange packets with an outside network. We can filter packets that are destined to our system using the Wireshark’s filtering function. For e.g. to filter the TCP packets destined to our system, use the filter:
ip.dst == ‘your_system_ip’ && tcp
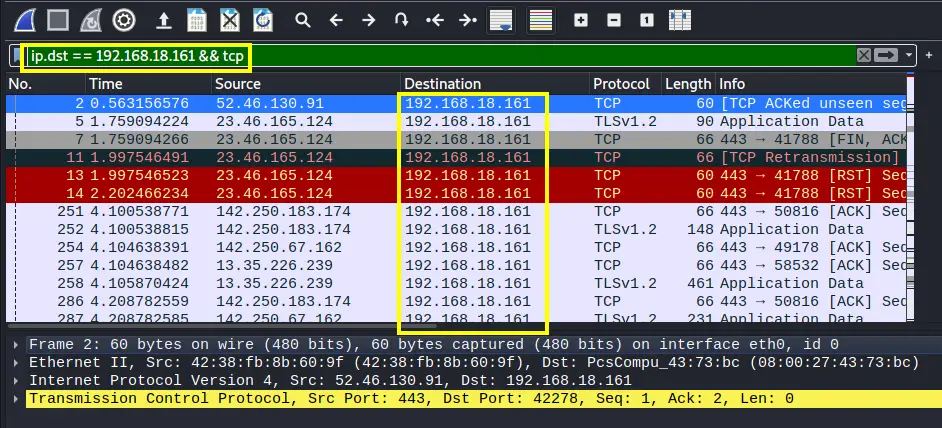
Replace the label ‘your_system_ip’ with your system IP. In our case, it is 192.168.18.161. Let us now look into the contents of these packets, right-click on any packet, and from the option list go to: ‘Follow -> Follow TCP Stream’. A new window should look similar to the window shown below:
If you are not able to use Wireshark for real-time network connection, you can also use a downloaded packet trace file.
Conclusion
Wireshark is a very important tool for analyzing what’s going on in your network. It has got wide acceptance among various IT sectors like government agencies, commercial organizations and educational institutions. While troubleshooting network issues, packet inspection is a very crucial step and Wireshark plays a vital role here. It has become an industry standard for analyzing network traffic.

