
The top command in Linux is a system monitoring tool that provides a dynamic, real-time view of the processes running on a system along with details about resource usage such as CPU, memory, and system load averages.
The main Features includes:
- Real-time Monitoring: top updates its display in real-time (or at intervals you can set).
- System Summary: Provides a quick summary of system status, like uptime, number of users, load averages, number of tasks, and CPU/Memory usage.
- Process-Level View: Displays detailed information about each process, including its PID (process ID), user, CPU and memory utilization, and the command that initiated it.
- Interactive Controls: Allows the user to interactively control its behavior, sort the display, and send signals to processes.
Basic Usage:
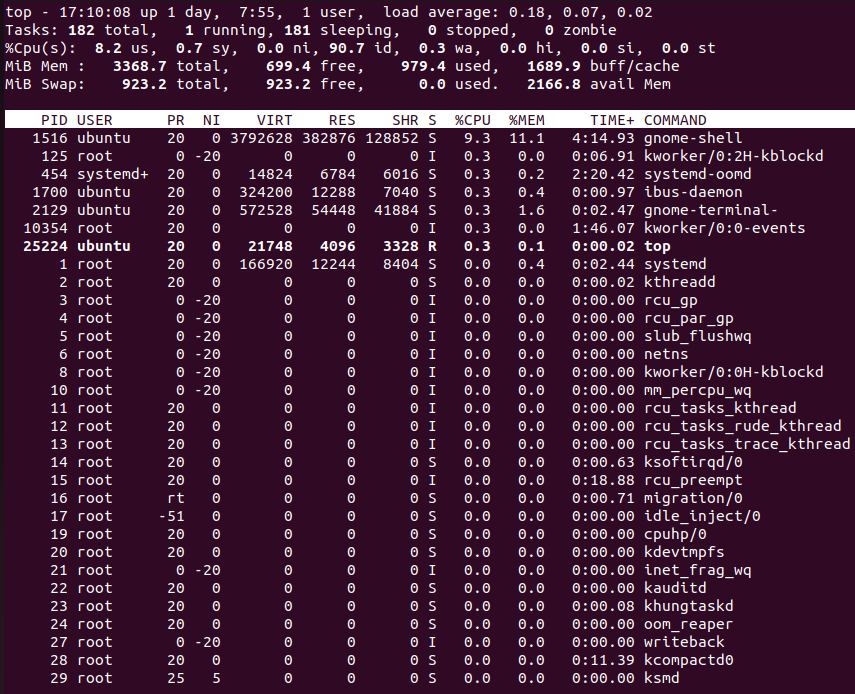
Simply typing top into your terminal will start it:
topThis will show you an overview of your system's activity. By default, it updates information every 3 seconds.
Top Output
Let's dive deeper into the top command's output by dissecting it line by line.
Line 1: Example:
top - 07:27:26 up 449 days, 59 min, 1 user, load average: 0.04, 0.02, 0.00- top: This indicates you're using the
toputility. - 07:27:26: This is the current system time when the command was run, displayed in hh:mm:ss format.
- up 449 days, 59 min: This shows how long the system has been running without a reboot. Here, it's been up for 449 days and 59 minutes.
- 1 user: This is the number of users currently logged into the system. In this case, there is 1 user logged in.
- load average: 0.04, 0.02, 0.00: These values represent the system load averages for the last 1, 5, and 15 minutes respectively.
Line 2: Example:
Tasks: 121 total, 1 running, 120 sleeping, 0 stopped, 0 zombie- Tasks: This refers to processes or threads that the system is managing.
- 121 total: This shows the total number of tasks or processes on the system. In this case, there are 121 tasks.
- 1 running: This is the number of tasks currently using the CPU (i.e., being executed). Here, 1 task is running.
- 120 sleeping: This is the number of tasks that are not currently using the CPU but are waiting (sleeping) for it to become available so they can run. In this case, there are 120 sleeping tasks.
- 0 stopped: This is the number of tasks that have been stopped, usually by a signal. A stopped process can be continued later. Here, no tasks have been stopped.
- 0 zombie: This is the number of "zombie" processes. These are processes that have finished execution (called "terminated"), but their exit status hasn't been read by their parent process yet. Here, there are no zombie processes.
Line 3: Example:
%Cpu(s): 0.5 us, 0.5 sy, 0.0 ni, 99.0 id, 0.0 wa, 0.0 hi, 0.0 si, 0.0 st- %Cpu(s): This represents the CPU usage statistics. If your machine has multiple CPU cores, this provides an averaged value across all cores.
- 0.5 us (user): The percentage of CPU time spent running user processes that are not niced, i.e., regular applications like a web browser or text editor. Here, it's 0.5%.
- 0.5 sy (system): The percentage of CPU time spent running kernel processes. Here, it's 0.5%.
- 0.0 ni (nice): The percentage of CPU time spent running user processes that have been "niced" – i.e., manually given lower priority. Here, it's 0.0%.
- 99.0 id (idle): The percentage of CPU time spent idle, with no processes using the CPU. Here, it's 99.0%.
- 0.0 wa (wait): The percentage of CPU time spent waiting for I/O operations to complete before being able to continue processing tasks. Here, it's 0.0%
- 0.0 hi (hardware interrupts): The percentage of CPU time spent handling hardware interrupts.
- 0.0 si (software interrupts): The percentage of CPU time spent handling software interrupts.
- 0.0 st (steal time): The percentage of CPU time in involuntary wait by the virtual CPU while the hypervisor services another virtual processor.
Line 4: Example:
MiB Mem : 3931.7 total, 2011.2 free, 296.5 used, 1624.0 buff/cache- MiB Mem: This section describes the main physical memory (RAM) of the system, measured in Mebibytes (MiB).
- 3931.7 total: This is the total amount of physical RAM available on the system. In this case, it's 3931.7 MiB.
- 2011.2 free: This is the amount of physical RAM that is not being used, i.e., free memory. Here, 2011.2 MiB of memory is free.
- 296.5 used: This is the amount of physical RAM that is currently used by applications. Here, 296.5 MiB of memory is in use.
- 1624.0 buff/cache: This is the amount of RAM used for temporary storage (buffers and caches). Buffers are used for input/output operations, and caches are used to store frequently accessed data to quicken access time.
Line 5 - Example:
MiB Swap: 512.0 total, 471.5 free, 40.5 used. 3217.7 avail Mem- MiB Swap: This section describes the system's swap space, which is a form of virtual memory that can be used when the system's physical memory is full. It is slower since it's essentially disk space.
- 512.0 total: The total amount of swap space available on this system. In this case, it's 512.0 MiB.
- 471.5 free: The amount of swap space currently unused or free. Here, there are 471.5 MiB of swap space available for use.
- 40.5 used: The amount of swap space currently in use. In this instance, 40.5 MiB of swap space is being used.
- 3217.7 avail Mem: The available memory that can still be used by the system, which is calculated as free + buffers/cache. This means there are 3217.7 MiB of RAM available for new processes.
Generally from Line 1 to Line 5 section is named Summary Area - which contains statistics about the overall system state. Below Line 5 section is named Task Area.
In the Task Area, you'll see a table of currently running processes with several important details about each process. Here's what each column represents:
- PID (Process ID): This is a unique identification number assigned to each process when it starts.
- USER: This indicates the username of the person (or the system) who owns the process.
- PR (Priority): This indicates the priority of the process. Tasks with higher priority will typically be given more CPU time.
- NI (nice value): This is related to the priority of the process. A higher nice value means lower priority, while a lower nice value means higher priority.
- VIRT (Virtual Memory Size): This represents the total amount of virtual memory used by the process.
- RES (Resident Memory Size): This represents the portion of the process’s memory that is held in RAM.
- SHR (Shared Memory): This represents the amount of shared memory used by a task. It simply reflects memory that could be potentially shared with other processes.
- %CPU: This represents the share of CPU time used by the process since the last update.
- %MEM: This represents the share of physical RAM used by the process.
- TIME+: This represents the total CPU time that the task has taken since it started.
- COMMAND: This is either the command line used to start the process or the name of this process.
Interactive Commands
top command is highly customizable. Below are some of the commonly used interactive commands within it.
General Controls:
qorCtrl+C: Quittop.hor?: Display help, which shows many of the interactive commands.Space: Refresh the display immediately.
Display Controls:
l: Toggle the display of load average and uptime.m: Toggle the display of memory information.t: Toggle the display of processes and CPU states.z: Toggle color highlighting.c: Toggle the command column between showing command and program name.E: This cycles through the available memory unit scales.e: This cycles the memory unit for individual processes in the process list, just likeE, but it affects the RES (resident size) column primarily.c: The COMMAND column will expand to display the complete command line for each process.V: To toggle tree view.1: This toggles the display between showing individual CPU cores and an aggregate view.z: Toggles the color display on or off.Z: Allows you to change or customize the color configuration interactively.- W: Write your custom configurations to a file. Store in ~/.config/procps/toprc in newer versions of the procps-ng package.
Sorting:
P: Sort processes by CPU usage (default).M: Sort processes by memory usage.T: Sort processes by time/cumulative time.N: sort processes by the PID column.
Process Controls:
k: Kill a process. After pressingk, you'll be prompted to enter the PID of the process you want to kill.r: Change the "niceness" of a process. This adjusts the priority of the process. After pressingr, you'll be prompted to enter the PID of the process you wish to renice.i: Toggles the display to show only the currently active tasks.n: Specify and limit the number of processes displayed on the screen.
Field Management:
forF: Enter the field management mode. This allows users to add or remove columns from the display. Once in this mode, you can use the arrow keys to navigate and select/deselect fields.
Filtering and Searching:
u: Show only processes owned by a specific user. After pressingu, you'll be prompted to enter the username.U: Remove user filter, showing processes of all users.L: Prompt for a name to highlight/locate. Allows searching for processes by name.
Display Update Rate:
d or s: Change the refresh interval of top. After pressing this, you'll be prompted to enter the desired update interval in seconds.
Interpreting Load Averages
One important concept to understand when using the top command is the load average. In the top command output, the load average is displayed ( Line 1 right side) as three numbers right after the "load average" text.
Here's an example of what you might see:
load average: 0.09, 0.05, 0.01The three numbers represent the system load averages for:
- The last 1 minute
- The last 5 minutes
- The last 15 minutes
But what does a "load average" mean?
Load averages represent the average number of processes that are either in a runnable or uninterruptable state. A process is in a runnable state when it is either using the CPU or waiting to use the CPU; it's in an uninterruptable state when it is waiting for I/O access, like waiting for disk.
Here's how to interpret these values:
- If your load averages are 0.0, that means your system is completely idle.
- If the averages are 1.00, that means your system is fully utilized; if your system has multiple cores, then this number could go up till number of cores. For example, if you have 4 cores, and load average is under 4.00, your system still has processing power.
- If the averages are above 1.00 (or above total number of cores in multi-core systems), then your system might be overloaded.
In general, for a single-core system, a load average of 1.00 is considered fully-loaded which is okay but it's something to watch. Anything above that indicates overload. For multi-core systems, you can divide the load average by the number of processor cores to get a comparable value.
Command Line Options
The top command in Linux comes with a variety of command-line options that allow you to customize its behavior, display only certain processes, and more. Here are some common command-line options that you might find useful:
-d: Changes the refresh interval in seconds.
top -d 2In the above example, the command's output will refresh every 2 seconds.
-b: Runs top in batch mode, which could be useful for sending output from top to other programs or to a file. In this mode, it doesn't require a terminal to run.
top -b > top-output.txt-c: This option tells top to display the full command path and command line arguments of the processes.
-u: Monitor all processes owned by a specific user.
top -u username-p: Monitor only specific processes, specified by their process IDs (PIDs)
top -p PID-H: Show threads instead of processes.
-n: Update the display this number of times, then exit.
top -n 10This command will update the display 10 times before exiting.
-i: Do not display idle tasks
-o: Sorts the display by <field>. This allows you to order the processes by specific criteria from the start.
top -o %MEMThis will order processes by memory usage.
-s: In this mode, it will function normally in terms of displaying information but will restrict the following interactive commands: k, r and w.
Use Case Examples
Sorting Processes Using top
By default, the top command sorts processes by the %CPU usage in descending order. However, you can sort the processes by any field you want. The interactive shortcut method is a handy way to do it.
While top is running, you can quickly sort the display using various keyboard shortcuts:
- Shift+M: Sort by memory usage (%MEM).
- Shift+P: Sort by CPU usage (%CPU).
- Shift+T: Sort by time/cumulative time.
- Shift+N: Sort by PID (Process ID).
Alternatively, you can do this using command line argument. For example:
top -o %MEMThis command will sort processes by memory usage on most Linux distributions.
Sending Signals to Processes
Using the top command, you can interactively send signals to processes without leaving the utility.
Start top with the command top in your terminal.
While top is running, press the k key (This stands for "kill"). This will prompt you for the Process ID (PID), but the PID of the process you highlighted will be the default.
After you press enter, another prompt will appear asking for a signal to send. If you want to send a TERM (terminate) signal, which is the default, simply press enter again.
Apart from top, there are direct ways to send signals to processes using commands like kill, pkill, and killall, which offer more versatility in targeting and managing processes.
Batch Mode Operation of top
Batch mode is useful for capturing snapshots of top output at particular intervals. It can be very useful for scripting and data analysis tasks, as it allows you to process top's output with other commands or save it in a file for later analysis.
Use -b option for running top in batch mode:
top -bIf you want to redirect output to a file for later inspection or analysis, you can use the standard output redirection operator (>):
top -b -n 10 > top_output.txtIn this example, the output from 10 iterations of top running in batch mode will be saved to the file top_output.txt.


Comments