
In this tutorial, we are going to show you how to install Grafana on Ubuntu 22.04 OS.
Grafana is an open-source interactive visualization web application that provides information about the data of the server. In other words, Grafana is a monitoring tool that servers information in graphs, charts, alerts, etc. In this blog post, we will show you that Grafana is a service that runs on a port and that can be accessed in two different ways, via IP address along with the port and with reverse proxy via the domain name.
Installing Grafana on Ubuntu 22.04 is a straightforward process and may take up to 20 minutes. Let’s get started!
Table of Contents
Prerequisites
- A server with Ubuntu 22.04 as OS
- Valid domain pointed to the servers IP address
- User privileges: root or non-root user with sudo privileges
Step 1. Update the System
Before we start with the Grafana installation, we will update the system packages to the latest versions available.
sudo apt-get update -y && sudo apt-get upgrade -y
Step 2. Install Nginx
We will start with installing the Nginx web server since, after the Grafana installation, we will need it for setting up the reverse proxy.
To install the Nginx web server execute the following command:
sudo apt install nginx -y
Once the installation is completed, start and enable the Nginx service:
sudo systemctl start nginx && sudo systemctl enable nginx
To check the status of the Nginx service, execute the following command:
sudo systemctl status nginx
You should receive the following output:
root@host:~# sudo systemctl status nginx
● nginx.service - A high performance web server and a reverse proxy server
     Loaded: loaded (/lib/systemd/system/nginx.service; enabled; vendor preset: enabled)
     Active: active (running) since Sat 2022-11-26 15:37:54 CST; 35s ago
       Docs: man:nginx(8)
   Main PID: 22797 (nginx)
      Tasks: 4 (limit: 4575)
     Memory: 5.2M
        CPU: 98ms
     CGroup: /system.slice/nginx.service
             ├─22797 "nginx: master process /usr/sbin/nginx -g daemon on; master_process on;"
             ├─22800 "nginx: worker process" "" "" "" "" "" "" "" "" "" "" "" "" "" "" "" "" "" "" "" "" "" "" "" "" "" "" ""
             ├─22801 "nginx: worker process" "" "" "" "" "" "" "" "" "" "" "" "" "" "" "" "" "" "" "" "" "" "" "" "" "" "" ""
             └─22802 "nginx: worker process" "" "" "" "" "" "" "" "" "" "" "" "" "" "" "" "" "" "" "" "" "" "" "" "" "" "" ""

Nov 26 15:37:54 host.test.vps systemd[1]: Starting A high performance web server and a reverse proxy server...
Nov 26 15:37:54 host.test.vps systemd[1]: Started A high performance web server and a reverse proxy server.
Step 3. Install Grafana
First, add the GPG keys:
wget -q -O - https://packages.grafana.com/gpg.key | gpg --dearmor | sudo tee /usr/share/keyrings/grafana.gpg > /dev/null
Then, we need to add the Grafana repository:
echo "deb [signed-by=/usr/share/keyrings/grafana.gpg] https://packages.grafana.com/oss/deb stable main" | sudo tee -a /etc/apt/sources.list.d/grafana.list
Once the key and the repository are added, update the system and install Grafana with the following commands:
sudo apt-get update -y

sudo apt-get install grafana -y
After successful installation, start and enable the Grafana service.
sudo systemctl start grafana-server && sudo systemctl enable grafana-server
To check the status of the service, execute the following command:
sudo systemctl status grafana-server
You should receive the following output:
root@host:~# sudo systemctl status grafana-server
● grafana-server.service - Grafana instance
     Loaded: loaded (/lib/systemd/system/grafana-server.service; enabled; vendor preset: enabled)
     Active: active (running) since Sat 2022-11-26 16:28:38 CST; 1min 49s ago
       Docs: http://docs.grafana.org
   Main PID: 23921 (grafana-server)
      Tasks: 15 (limit: 4575)
     Memory: 42.5M
        CPU: 2.494s
     CGroup: /system.slice/grafana-server.service
By default, the Grafana service is running on port 3000. To check this, execute the following command:
netstat -tunlp | grep 3000
You should receive the following output:
root@host:~# netstat -tunlp | grep 3000
tcp6       0      0 :::3000                 :::*                    LISTEN      23921/grafana-serve
Now, when the service is up and running on port 3000, you can access Grafana at http://YourServerIpAddress:3000
Step 4. Create Nginx Virtual Host File
The purpose of installing the Nginx Web server was this step, where we would configure the reverse proxy for Grafana. With a reverse proxy, we will be able to access the Grafana monitoring tool via the domain name previously pointed to the server IP address as described in the Requirements section.
To create the Nginx configuration file, execute the following command:
touch /etc/nginx/sites-available/grafana.conf
Open the file with your favorite editor and paste the following lines of code:
server {
        root /var/www/html;
        index index.html index.htm index.nginx-debian.html;

        server_name YourDomainHere;

        location / {
                proxy_set_header Host $http_host;
                proxy_pass http://localhost:3000;
        }

        location /api/live {
                proxy_http_version 1.1;
                proxy_set_header Host $http_host;
                proxy_pass http://localhost:3000;
        }
}
Save the file, close it and create the symbolic link to enable the Nginx configuration.
ln -s /etc/nginx/sites-available/grafana.conf /etc/nginx/sites-enabled/
After this, check the syntax of the Nginx:
nginx -t
You should receive the following output:
root@host:~# nginx -t
nginx: the configuration file /etc/nginx/nginx.conf syntax is ok
nginx: configuration file /etc/nginx/nginx.conf test is successful
Now, you can restart the Nginx service.
sudo systemctl restart nginx
After a successful restart, you can access the Grafana monitoring tool via your domain at http://YourDomain.com

The default username and password are admin, and admin, respectively. Enter these credentials and hit on the Login button.

Grafana will ask you to set a new strong password. Set it and hit on the Submit button.

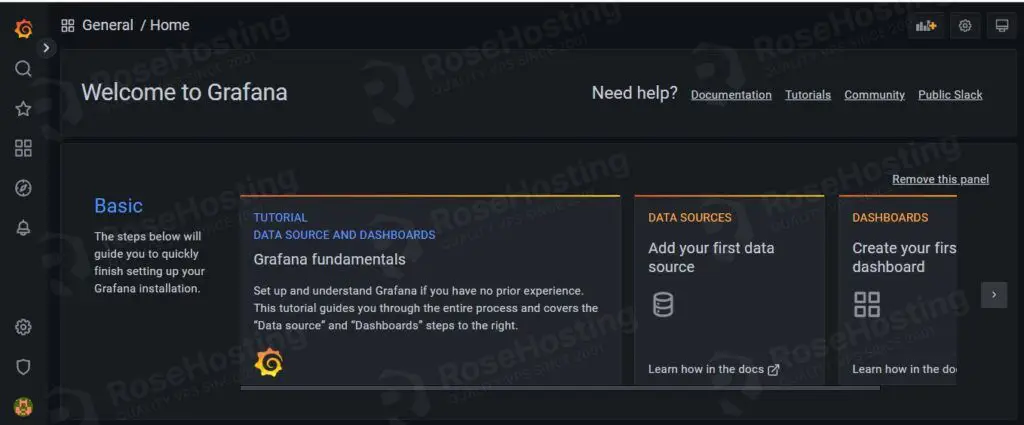
After you submit the new password, you will be logged in automatically to the Grafana admin dashboard.
That’s it. You learned how to install Grafana with Nginx as a reverse proxy on Ubuntu 22.04. If you find this setup difficult for you, feel free to contact our epic technical support, and they will help you with any aspect of installing and configuring Grafana. You just need to sign up for one of our NVMe VPS plans and submit a support ticket. We are available 24/7.
If you liked this post on how to install Grafana on Ubuntu 22.04, please share it with your friends on social networks or simply leave a reply below. Thanks.