Monitoring Multiple Systems With munin (Debian Etch)
In this article, I will describe how you can monitor multiple systems with munin. munin produces nifty little graphics about nearly every aspect of your server (load average, memory usage, CPU usage, MySQL throughput, eth0 traffic, etc.) without much configuration. I will install the munin client on all systems that are to be monitored (including the munin server itself); the munin clients will then report to the munin server.
This tutorial was written for Debian Etch, but the configuration should apply to other distributions with little changes as well.
I want to say first that this is not the only way of setting up such a system. There are many ways of achieving this goal but this is the way I take. I do not issue any guarantee that this will work for you!
1 Preliminary Note
Our munin server's hostname is server1.example.com (IP address: 192.168.0.100), and we have a web site www.example.com on it with the document root /var/www/www.example.com/web on it.
I'm using one munin client here, server2.example.com (IP address: 192.168.0.101). Of course, you can add as many client systems as you like.
2 Install And Configure munin On The Server
munin server (server1.example.com):
To install the munin client and server on Debian Etch, we do this:
apt-get install munin munin-node
Next, we must edit the munin configuration file /etc/munin/munin.conf. We want munin to put its output into the directory /var/www/www.example.com/web/monitoring, therefore we change the value of htmldir, and we want it to use the name server1.example.com instead of localhost.localdomain in the HTML output, therefore we replace localhost.localdomain with server1.example.com. With this configuration, the munin server is able to monitor itself. Without the comments, the changed file looks like this:
vi /etc/munin/munin.conf
dbdir   /var/lib/munin
htmldir /var/www/www.example.com/web/monitoring
logdir  /var/log/munin
rundir  /var/run/munin

tmpldir /etc/munin/templates

[server1.example.com]
    address 127.0.0.1
    use_node_name yes
|
Next we create the directory /var/www/www.example.com/web/monitoring and change its ownership to the user and group munin, otherwise munin cannot place its output in that directory. Then we restart munin:
mkdir -p /var/www/www.example.com/web/monitoring
chown munin:munin /var/www/www.example.com/web/monitoring
/etc/init.d/munin-node restart
Now wait a few minutes so that munin can produce its first output, and then go to http://www.example.com/monitoring/ in your browser, and you see the first statistics. After a few days this could look like this:
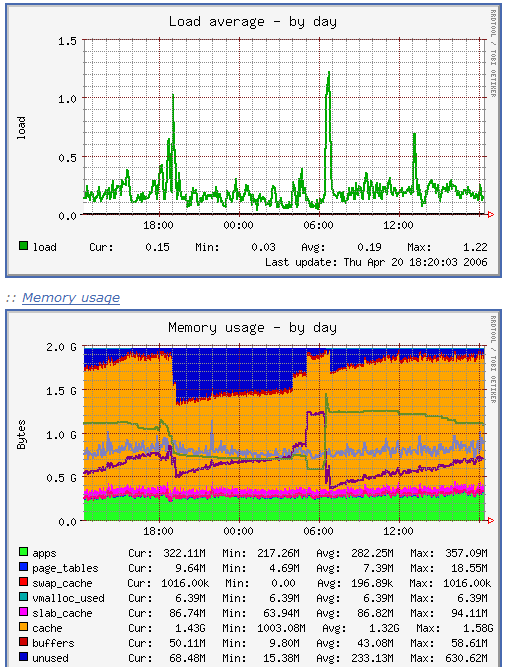
(This is just a small excerpt of the many graphics that munin produces...)
3 Password-Protect The munin Output Directory On The munin Server (Optional)
munin server (server1.example.com):
Now it is a good idea to password-protect the directory /var/www/www.example.com/web/monitoring unless you want everybody to be able to see every little statistic about your server.
To do this, we create an .htaccess file in /var/www/www.example.com/web/monitoring:
vi /var/www/www.example.com/web/monitoring/.htaccess
AuthType Basic AuthName "Members Only" AuthUserFile /var/www/www.example.com/.htpasswd <limit GET PUT POST> require valid-user </limit> |
Then we must create the password file /var/www/www.example.com/.htpasswd. We want to log in with the username admin, so we do this:
htpasswd -c /var/www/www.example.com/.htpasswd admin
Enter a password for admin, and you're done!
4 Install And Configure munin On The Client
munin client (server2.example.com):
On the client system, we only have to install the munin client package which is called munin-node:
apt-get install munin-node
Next we must tell the munin client that our munin server server1.example.com with the IP address 192.168.0.100 is allowed to connect to retrieve details from the client. To do this, we open /etc/munin/munin-node.conf and add the line allow ^192\.168\.0\.100$ at the bottom of it. Afterwards, the file should look like this:
vi /etc/munin/munin-node.conf
# # Example config-file for munin-node # log_level 4 log_file /var/log/munin/munin-node.log port 4949 pid_file /var/run/munin/munin-node.pid background 1 setseid 1 # Which port to bind to; host * user root group root setsid yes # Regexps for files to ignore ignore_file ~$ ignore_file \.bak$ ignore_file %$ ignore_file \.dpkg-(tmp|new|old|dist)$ ignore_file \.rpm(save|new)$ # Set this if the client doesn't report the correct hostname when # telnetting to localhost, port 4949 # #host_name localhost.localdomain # A list of addresses that are allowed to connect. This must be a # regular expression, due to brain damage in Net::Server, which # doesn't understand CIDR-style network notation. You may repeat # the allow line as many times as you'd like allow ^127\.0\.0\.1$ allow ^192\.168\.0\.100$ |
Finally, we restart the munin client:
/etc/init.d/munin-node restart
5 Update The munin Server Configuration
munin server (server1.example.com):
Now we must tell the munin server that there's another system to monitor (server2.example.com with the IP address 192.168.0.101). To do this, we open /etc/munin/munin.conf and add a stanza for server2.example.com so that the file looks like this:
vi /etc/munin/munin.conf
dbdir   /var/lib/munin
htmldir /var/www/www.example.com/web/monitoring
logdir  /var/log/munin
rundir  /var/run/munin

tmpldir /etc/munin/templates

[server1.example.com]
    address 127.0.0.1
    use_node_name yes

[server2.example.com]
    address 192.168.0.101
    use_node_name yes
|
Next, we restart munin:
/etc/init.d/munin-node restart
After a few minutes, you should find a link for server2.example.com on the munin page (http://www.example.com/monitoring/):
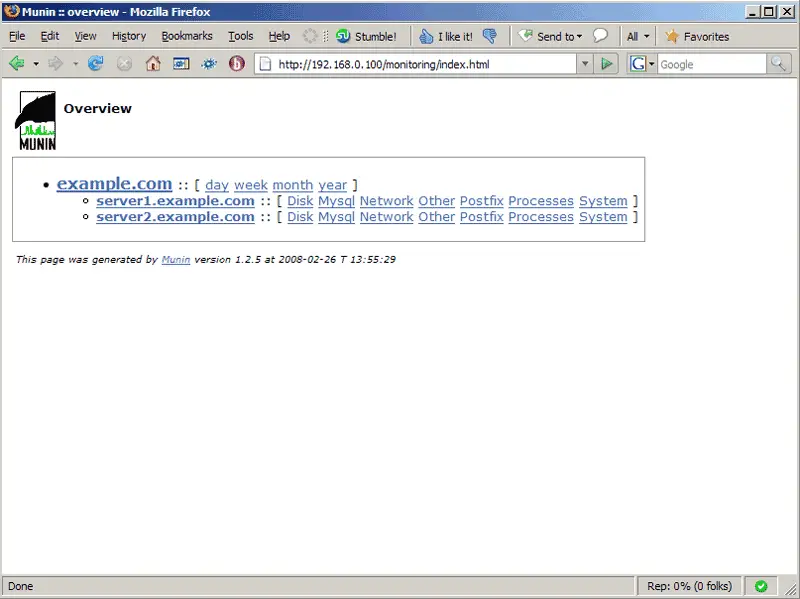
When you click on that link, you will see the graphs for server2.example.com.
6 Links
- munin: http://munin-monitoring.org/

