Monitoring ESX/ESXi Servers
Abstract
The purpose is to highlight the most important topics related to setting up ESX/ESXi monitoring as well as applications hosted within managed virtual machines (a MySQL database is used in this tutorial).
Tools used:
- VMware vSphere Hypervisor (ESXi): http://www.VMware.com/products/vsphere/esxi-and-esx
- MySQL: http://www.mysql.com/downloads
- Monitoring tool: http://www.veraxsystems.com/en/products/nms
Agenda:
1. Adding an ESX/ESXi server to the list of monitored devices within NMS.
2. Configuring availability sensors and performance counters for the server.
3. Configuration of monitoring of an application running in a virtual machine on the server
(a MySQL database in this case).
4. Setting up sensors and counters for the application.
5. Setting up alarms and notification policies.
1. Adding a VMware server to device inventory
In order to add a VMware ESX/ESX server to Verax NMS device inventory perform the following steps:
1. Log in into the Verax NMS and select Home from the main menu.
2. Select All devices node in the left-side aspects view.
3. Select the Add device action (below the right-hand device list) and click Go.
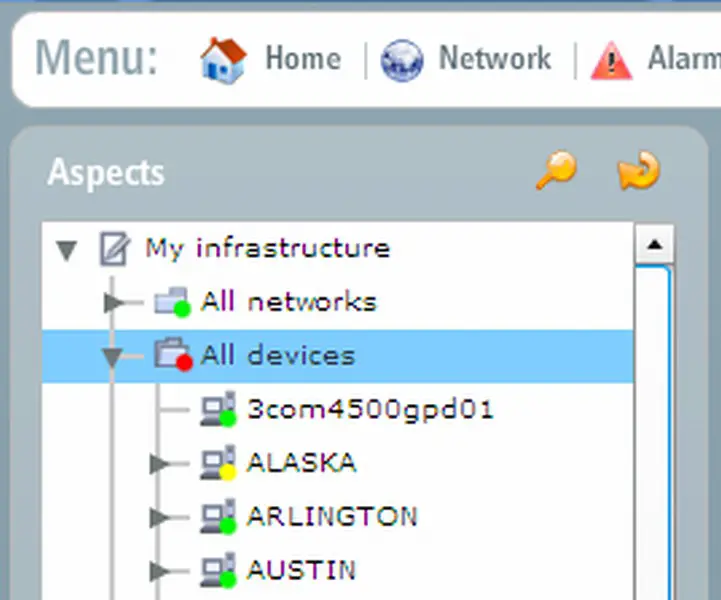
Figure 1: Aspect hierarchy tree
4. A pop-up dialog is displayed.
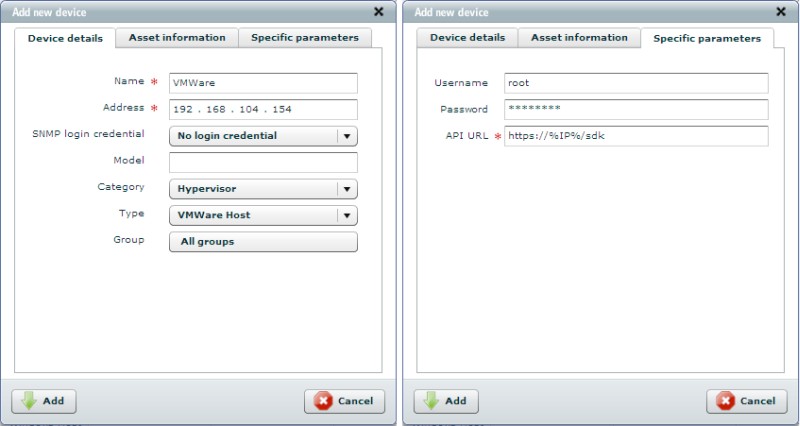
Figure 2: Adding a new device
5. Provide the required fields and click Add. Note: The API URL field (Specific parameters tab) is mandatory; however the system will automatically populate it based on the provided IP address.
6. Select No for SNMP rediscovery option.
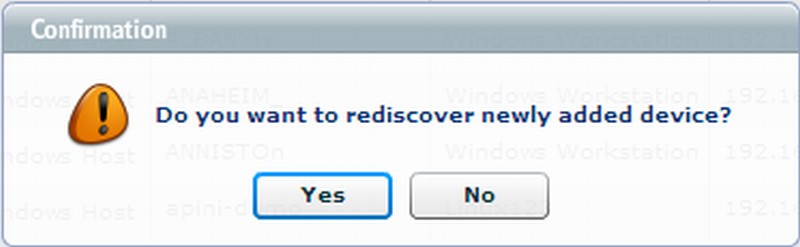
Figure 3: Confirmation dialog
7. The newly added device is now visible in the aspect tree and devices list (Network view).
In order to display server, select the device in the aspect tree and click Show advanced view. A pop up with details will be displayed.
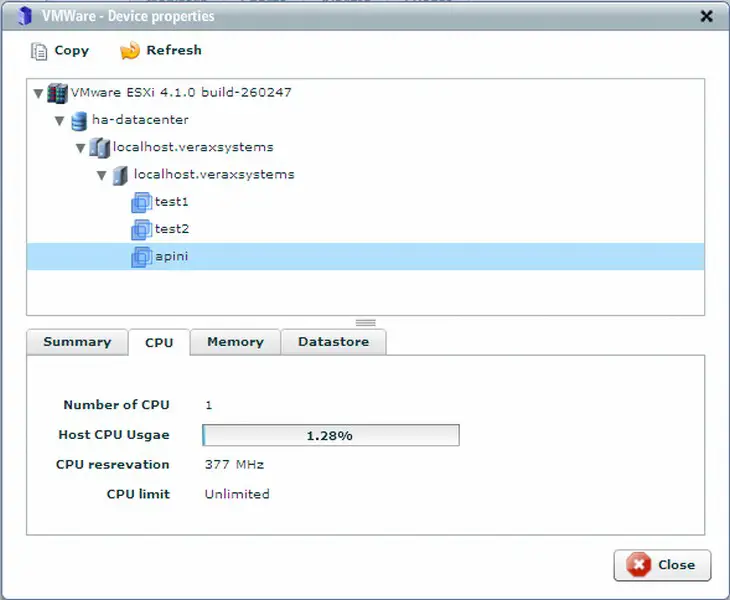
Figure 4: Device properties window
In this example, the system discovered three VMs named: test1, test2, apini. Clicking on a VM will display more details on its configuration & performance metrics.
2. Adding sensors for ESX/ESXi server
In order to add a sensor, perform the following steps:
1. Select device from the aspect tree in Home view (a VMware server in this case).
2. Select Monitors tab and switch to sensor list by clicking Sensor list link in upper-right corner of the tab field.
3. Sensor list is displayed.
4. Select Add from the global action menu and click the Go.
5. The wizard dialog is displayed.
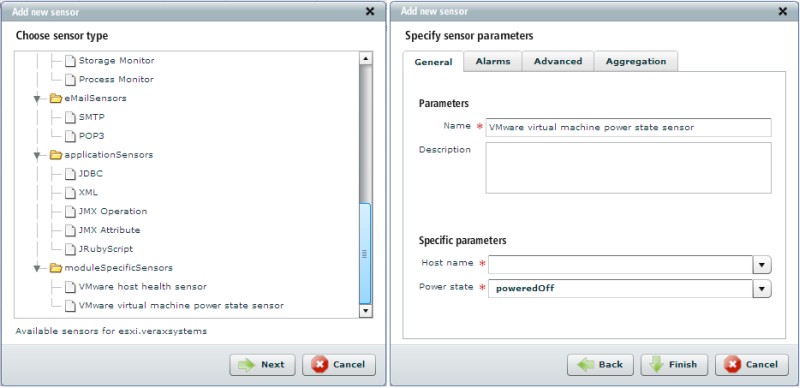
Figure 5: Adding a sensor
6. Select the sensor you want to add and click Next.
7. A dialog shows up with all sensor parameters to be provided. Specify the sensor parameters and click Finish.
8. Once the sensors have been added, they are visible in the sensor list (Monitors tab).
3. Adding performance counters for a ESX/ESXi server
In order to add VMware performance counters perform the following steps:
1. Select device from aspect tree in Home view.
2. Select Monitors tab and switch to counter list by clicking Counter list link in upper-right corner of the tab field. Counter list is displayed.
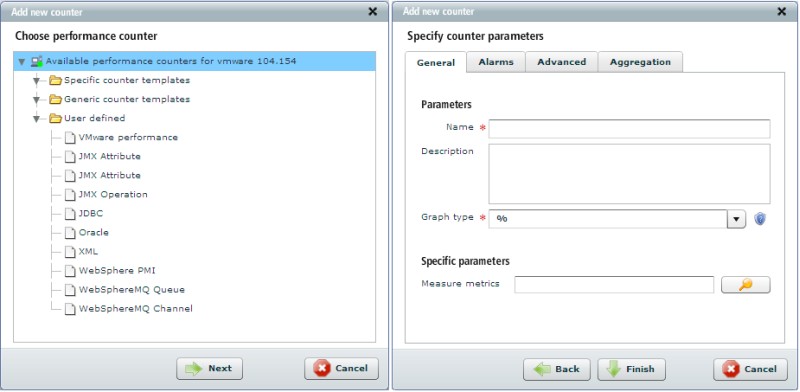
Figure 6: Adding a counter
3. Select Create counter from the global action menu and click Go. Select counter you want to create click Next.
4. Once the data has been loaded, the edit window shows up with all counter attributes to be provided.
5. To select desired measure metric click on the icon next to the measure metrics field. System will display the structure of your ESX/ESXi server and the list of available counters for each component.
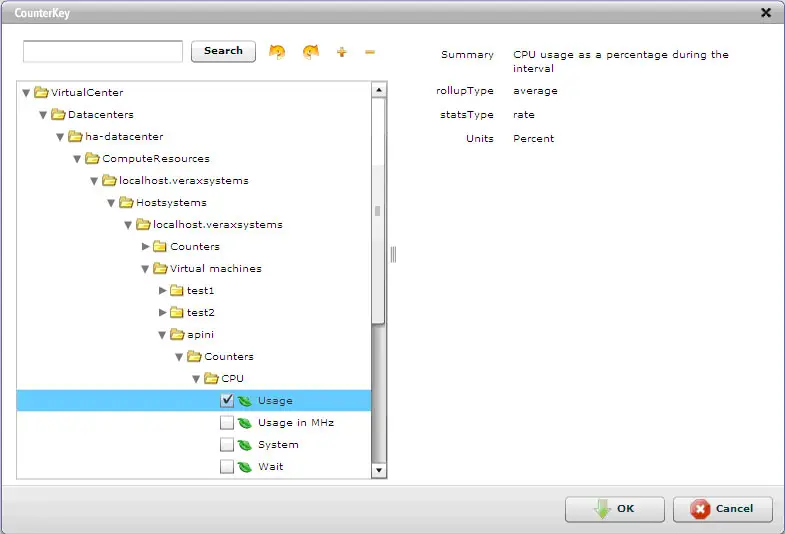
Figure 7: Selecting measure metrics
6. Select desired metric for a component you want to monitor and click OK.
7. Finish specifying the rest of counter's parameters (alarms, thresholds etc.) and click Finish or Cancel to discard changes.
8. New counter has been created and it's now visible in counter list.
Important:
After adding sensors and counters for a VMware host click Refresh counters and sensors from the Actions section in a device view.

