How to quickly get list of all applications installed on your UNIX/Linux machines
In this tutorial I'll try to present how to quickly get the list of all applications installed on UNIX/Linux hosts. The procedure applies to the most popular UNIX/Linux distributions but is also applicable to windows hosts and some other hardware (e.g. firmware version on routers etc.). The procedure could help you track your software inventory and get notifications whenever users install/uninstall applications on their machines.
Step 1: Preparing UNIX/Linux hosts (important)
Note that data about installed applications will be collected via SNMP. In order to properly discover and collect data from hosts using SNMP, it's necessary to install and enable the SNMP Agent on the device itself also make sure that SNMP protocol is enabled on your firewall.
Step 2: Discovering UNIX/Linux machines
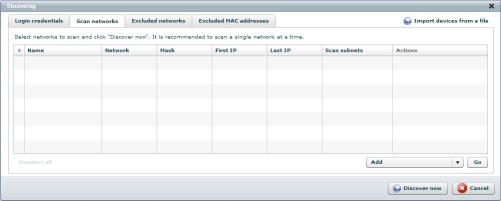
I'll be using free version of Verax NMS & APM because of its installed software monitor (it's limited to 10 devices but it should be enough for small network). The first thing you need to do after installation is to let system discover all your UNIX/Linux machines.- Click the Discovery button from the options panel in the upper-right corner and go to Scan networks tab.
- Select Add from the menu and click Go.
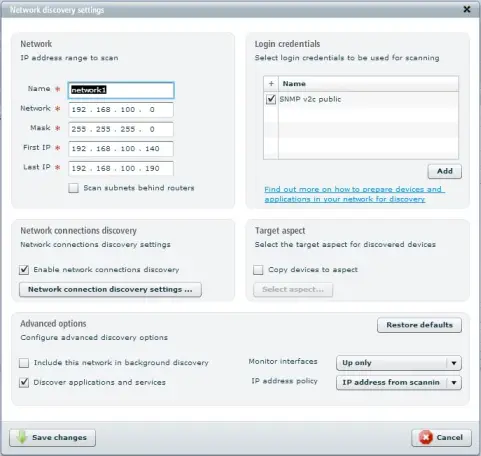
- Now, you have to specify your network settings - just fill in the basic mandatory parameters such as IP addresses range in the network section and select SNMP login credentials. You can leave additional parameters in default.
- Click Save changes to confirm.
- Now, select the network you've just added and click the Discover now button.
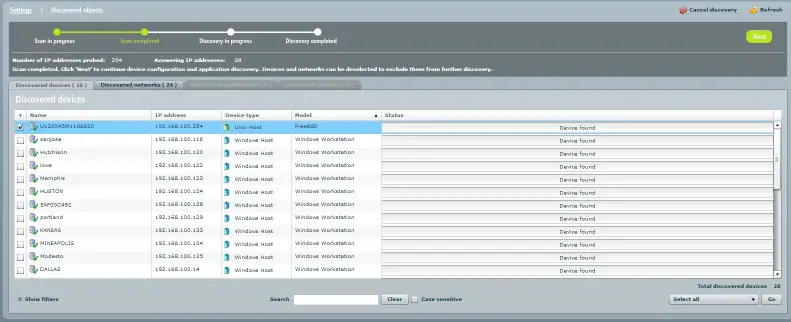
- The scan process will take a couple of minutes, depending on the size of your network (it's faster to start the discovery process for a single network at a time, instead of multiple networks simultaneously).The bar on the top of the view will display the current progress of the discovery process. Once the scan process has been completed, you will be shown the scan results.
- Select all your UNIX/Linux machines (all with "Unix Host" in Device Type column) and click Next.
- For all selected devices the system automatically discovers interfaces, processors, disks, etc. it will also configure default monitors including Installed software sensor, which we needed to collect data about installed applications.
Note: Discovered applications/services tabs contain the list of services or applications such as database servers that can be monitored as separate entities. They do not contain information about desktop applications such as web browsers, etc.
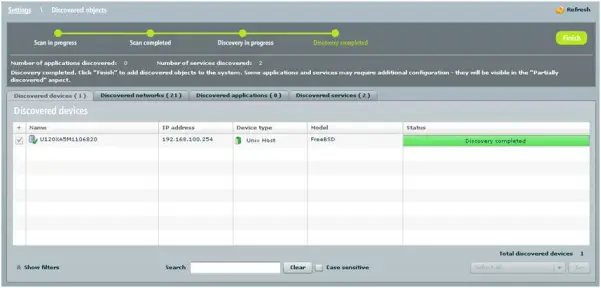
- Click Finish button on the top bar in order to finish discovery.
- Right now, your UNIX/Linux machines are added to the inventory and have initial set of monitors added including the installed software sensor. All discovered machines will be visible in the Network view as well as in Home view.
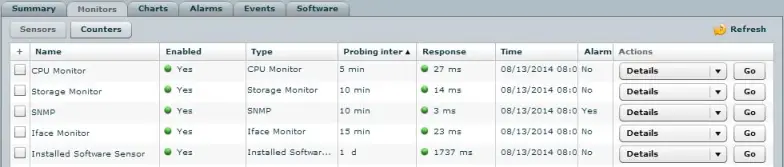
- At this point, each machine have Installed Software Sensor attached which will routinely probe for data regarding installed software. In order to see the full list of monitors attached to a device during discovering, select desired device from aspects tree (Home view) and click Monitors tab.
Step 3: Displaying installed software sensors list
- The information collected by the Installed Software Sensors is aggregated and displayed in Software inventory view.
- To display Software inventory click Software in the main menu.
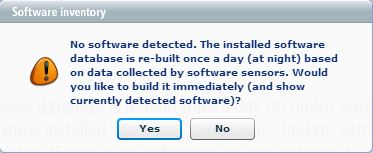
- Since, it's the first time use the system will ask if you want to build the installed software database - click Yes.
Note: it may take a few minutes before sensors collect initial data, so don't panic if you get an error, just wait 2-3 minutes.
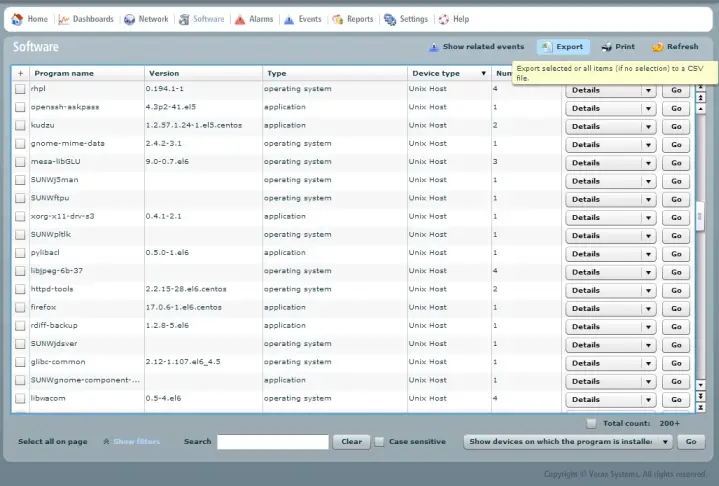
The Software view contains the list of applications installed on all your UNIX/Linux machines. You can browse the inventory (by app, by device, etc.) or export it to a CSV.
To see software installed on a particular machine, you can use filters (left-bottom corner) or you can select device from aspects tree (home view) and click its Software tab.
By default, software inventory is updated once a day (based on a data collected by sensors). If you want to see the current status of your software inventory select Update software inventory option from menu and click Go.
Important: As mentioned before the Software inventory is updated once a day. Installed software sensors added during discovering also have probing interval set to "1day" which means that they will collect data once a day. If you want to collect data more often you have to change (decrease) sensors' probing intervals.
Changing probing interval
If you want to change probing interval for software sensor (e.g. to 10 min), perform the following steps:
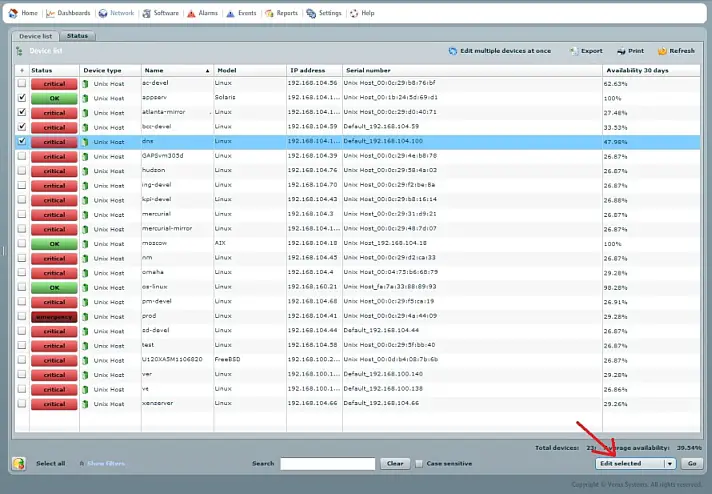
- Click Network from the main menu to display the list of all devices.
- Select desired machines by selecting their corresponding check boxes in the first column.
- Select Edit selected from the action menu and click Go.
- The edit window shows up. Go to the Sensors tab.
- Find Installed Software Sensor and select Edit action. Change the probing interval (make sure that field-corresponding box is checked) and click Finish.
- Click Save changes to confirm.
About alerting
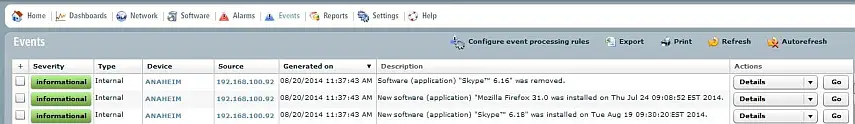
By default, information about changes in software inventory (users installing/uninstalling their applications) will appear as an "Informational" events in Events view (click Events in main menu).
You can set up separate alarms, notifications and other procedures (e.g. run script, rise a ticket in helpdesk, etc.) using event processing rules, however to keep this tutorial as short as possible I won't be describing how to do this now.
Appendix: adding Installed Software Sensor manually
In case you don't want to add sensors automatically during network discovery, this part shows how to manually add sensors for already monitored machines.
- Click Network from the main menu to display the list of all network devices.
- Select devices by selecting their corresponding check boxes in the first column.
- Select Edit selected from the action menu.
- The edit window shows up. Go to the Sensors tab.
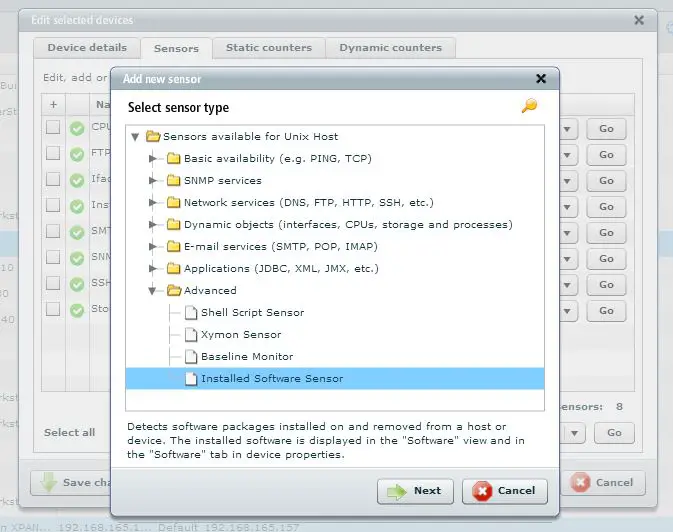
- Select Add from the action menu and click Go. The wizard dialog is displayed.
- Select Installed Software Sensor under the Advanced and click Next.
- You can now specify sensor probing interval or other parameters and click Finish.
- Click Save changes to confirm.
The alternative way to do this is to select all machines in Network view and select "rediscover" option from the menu.

