Elasticsearch and Kibana: installation and basic usage on Ubuntu 16.04
Elasticsearch is a powerful production-ready search engine written in Java. It can be used as a standalone search engine for the web or as a search engine for e-commerce web applications.
eBay, Facebook, and Netflix are some of the companies that use this platform. Elasticsearch is so popular because it is more than just a search engine. It is also a powerful analytics engine and a log management and retrieval system. The best part about it is that it is Open Source and free to use. Kibana is the visualization tool provided by elastic.
In this tutorial, we will be going through the installation steps for Elasticsearch followed by the installation of Kibana. Then we will use Kibana to store and retrieve data.
1 Installing Java
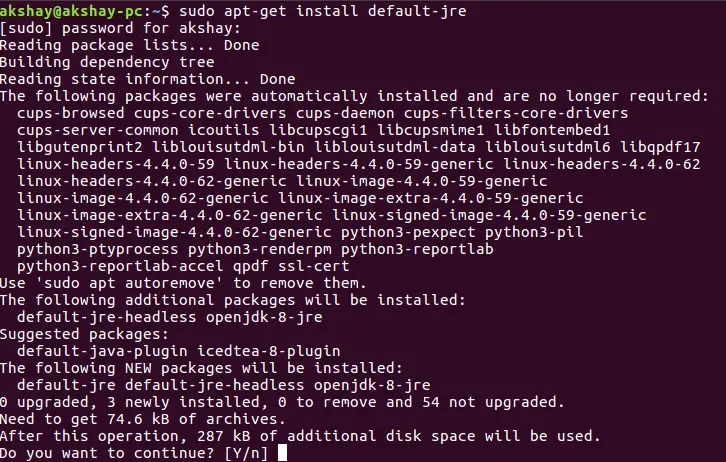
Since Elasticsearch is written in Java, it has to be installed first. Use the commands below to install the open source versions of JRE and JDK:
 sudo apt-get install default-jre
 sudo apt-get install default-jdk
These two commands will install the latest open-jre and open-jdk on your system. I'll use JAVA 8 here. The following images show, the output you will get when you do not have java installed and run the above commands.

2 Install Elasticsearch
Elasticsearch 5 has been released recently. It has some massive changes compared to its previous versions of 2.x. At the time of writing this article, version 5.2.2 is the latest release and we will be installing that. So follow the below steps to install.
mkdir elasticsearch; cd elasticsearch

wget https://artifacts.elastic.co/downloads/elasticsearch/elasticsearch-5.2.2.deb
With this, the .deb file should start downloading. It will look similar to the image below:

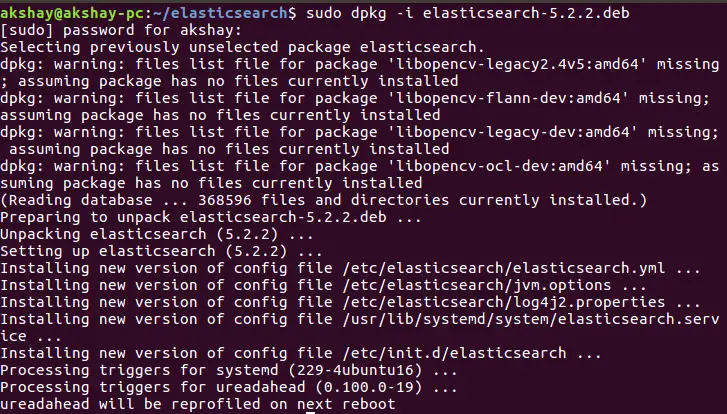
Once the download is successfully completed, we can install it by running the following command. The output of successful installation is below.
sudo dpkg -i elasticsearch-5.2.2.deb
3 Configure and Run Elasticsearch
Elasticsearch runs as a background process. But before we start it we have to edit the config file to add the current system as the host running the engine. use the following command to open the config file:
sudo gedit /etc/elasticsearch/elasticsearch.yml
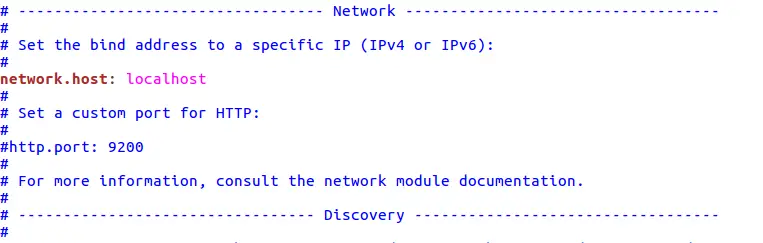
Once the editor opens, you have to uncomment the line:
#network.host: 192.168.0.1
and then change the IP to localhost as shown in the image below:
Now, we are ready to run the process. Use the following commands:
sudo systemctl daemon-reload
sudo systemctl enable elasticsearch
sudo systemctl restart elasticsearch
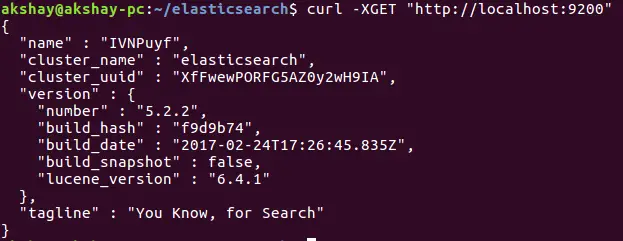
These three commands add the Elasticsearch process to the system daemon so that it will automatically start when your system boots up and then it restarts the process itself. To test if the system is up and running, use the following command. The output should be similar to the image shown below.
curl -XGET "http://localhost:9200"
4 Install Kibana
Download and install the deb file using the following commands:
wget https://artifacts.elastic.co/downloads/kibana/kibana-5.2.2-amd64.deb
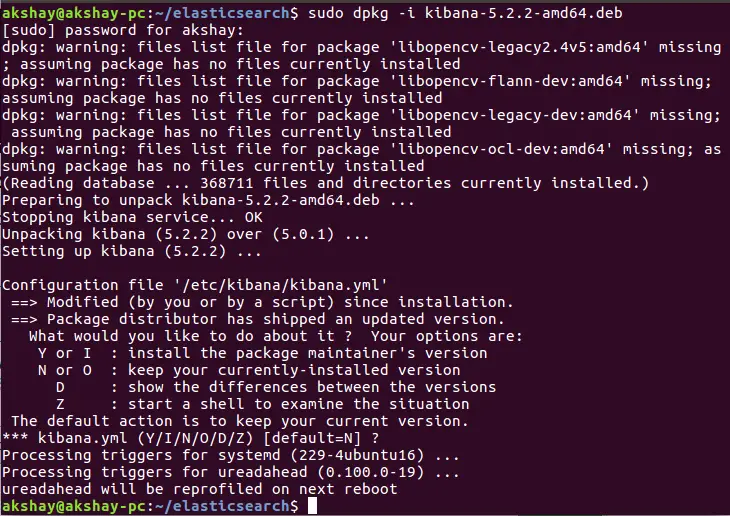
sudo dpkg -i kibana-5.2.2-amd64.deb
while running the second command, if it asks you to modify the existing Kibana config file, you can press enter to keep defaults and finish the competition. Once it has been installed, it will look similar to the image below.
5 Configure and Run Kibana
in the Kibana configuration file, uncomment the following lines:
server.port:
server.host:
server.name:
elasticsearch.name:
kibana.index:
Use the following command to open the config file. The file after you have made the changes should look like the image below:
sudo gedit /etc/kibana/kibana.yml
"server.name" can be anything, so feel free to change it. Once these changes are made, save and close the file. The final thing to do is to add Kibana process to the system process list so that it starts automatically each time the system boots up. Run the following commands:
sudo systemctl daemon-reload
sudo systemctl enable kibana
sudo systemctl start kibana
Once these commands are run, you can open your web browser and use the following URL to test if it has been installed correctly. The image below shows how it should look:
http://localhost:5601

That's it. You have now successfully installed Kibana and Elasticsearch.
6 Basic Usage
We can use the "Dev Tools" utility provided by Kibana to talk to Elasticsearch. It provides a clean and simple interface to execute the commands as JSON objects. We will be interacting with the core engine through a REST interface.
Go to the "Dev Tools" by clicking on the  icon on the left Panel. You can also use the following URL:
http://localhost:5601/app/kibana#/dev_tools/
Once it loads, you will get a "Welcome to Console" introduction to the UI. You can read that or just click on the "Get To Work" Button at the bottom of that intro. Once you click on that button, the UI will look like the image below:

On the left side we will type the commands and on the right side panel we will get the output. Let us try to send and store some data to the search engine.
6.1 Create an Index
Data is stored in an index. To create an index, we use the PUT command. The request JSON will contain the name of the index and some optional settings that we can provide. The following command is an example to create an index called "student".
PUT student
{
 "settings": {
 "number_of_shards": 3

 }
}
You can type this on the "Dev Tools" and press the green play button beside it to run it. The output will be similar to the image below:

6.2 Insert some data to index
We will be using the POST calls to insert data to index. The data to be inserted is in the form of JSON and so let us go ahead add students to the index. The Command is :
POST student/course
{
"name":"james",
"course": "mathematics"
}
In the above command, "course" indicates the type of data that is being indexed. From the response, you can see that, this entry has got a unique id as well. In the command below, you can see that there is another parameter after "course", this is how you can specify what is the id for this student entry. This way, elasticsearch will not bother to create an ID but use this as the ID of this record.
POST student/course/2
{
"name":"tina",
"course": "physics"
}
Following are the images that show the response from the search engine when both the commands are run:


6.3 Fetch data from Index
You can also fetch data be various fields from the stored record or entry. Each entry that we saved in the previous step is called a document in Elasticsearch. We will be using the GET call to fetch documents from the index. Here is how you can fetch one document using the "name" field:
GET student/course/_search
{
"query": {
"term": {
"name": {
"value": "james"
}
}
}
}
This command searches the "student" index for documents of type "course" and tries to match a term with field name "name" which has the value "James". Since there is a student named James in the index, we get a response as shown in the image below:

These were just basics, There are tons of things that can be done with Elasticsearch and lots of exploration is required to master this framework and use it to the best of its capability.

