How to Install Grafana on Rocky Linux
Grafana is free and open-source analytics and visualization tool. It's a multi-platform web-based application that provides customizable charts, graphs, and alerts for supported data sources.
By default, Grafana supports multiple data sources like Prometheus, Graphite, InfluxDB, Elasticsearc, MySQL, PostgreSQL, Zabbix, etc. It allows you to create an interactive and beautiful dashboard for your application monitoring system.
This tutorial will show you how to install Grafana with Nginx as a Reverse Proxy on the Rocky Linux system.
Prerequisites
To get started, ensure the following requirements are in place:
- Operating System: Rocky Linux 8.5 (Green Obsidian)
- Root privileges
Now let's begin.
Add Grafana repository
To install Grafana on the Rocky Linux system, add the Grafana repository manually to your system.
1. Create a new repository configuration 'grafana.repo' under the directory '/etc/yum.repos.d/'. You can use nano or vim as your editor.
sudo nano /etc/yum.repos.d/grafana.repo
Copy and paste the following Grafana repository configuration.
[grafana]
name=grafana
baseurl=https://packages.grafana.com/oss/rpm
repo_gpgcheck=1
enabled=1
gpgcheck=1
gpgkey=https://packages.grafana.com/gpg.key
sslverify=1
sslcacert=/etc/pki/tls/certs/ca-bundle.crt
Now save the configuration and exit.
2. After you've added the grafana repository, verify using the DNF command below.
sudo dnf repolist
Ensure you get the 'grafana' repository as below.
repo id                                      repo name
appstream                                    Rocky Linux 8 - AppStream
baseos                                       Rocky Linux 8 - BaseOS
extras                                       Rocky Linux 8 - Extras
grafana                                      grafana
3. Next, check the grafana package on the official repository using the command below.
sudo info grafana
If you get asked to confirm the GPG key of the grafana package, type 'y' and press 'Enter' to confirm.
Importing GPG key 0x24098CB6:
 Userid     : "Grafana <[email protected]>"
 Fingerprint: 4E40 DDF6 D76E 284A 4A67 80E4 8C8C 34C5 2409 8CB6
 From       : https://packages.grafana.com/gpg.key
Is this ok [y/N]: y
Now you will see the grafana v8.2.5 currently available in the official repository.
Name         : grafana
Version      : 8.2.5
Release      : 1
Architecture : x86_64
Size         : 64 M
Source       : grafana-8.2.5-1.src.rpm
Repository   : grafana
Summary      : Grafana
URL          : https://grafana.com
License      : "Apache 2.0"
Description  : Grafana
Installing Grafana on Rocky Linux
To install grafana on Rocky Linux, use the DNF command. And after installation completes, start and enable the grafana service, then verify the status of the grafana service. You can use the systemctl command to verify the current status of the grafana service or use the 'ss' command to check default grafana port '3000' and make sure it's on the 'LISTEN' state.
1. Execute the DNF command below to install grafana on your system.
sudo dnf install grafana -y
The installation will take some time, depending on your server connection.
Below are some grafana installation environments you must know:
- The default configuration is available at the '/etc/grafana' directory.
- Grafana configuration file is using the fomat .INI. The main configuration is 'grafana.ini'.
- The service file for grafana is 'grafana-server.service'.
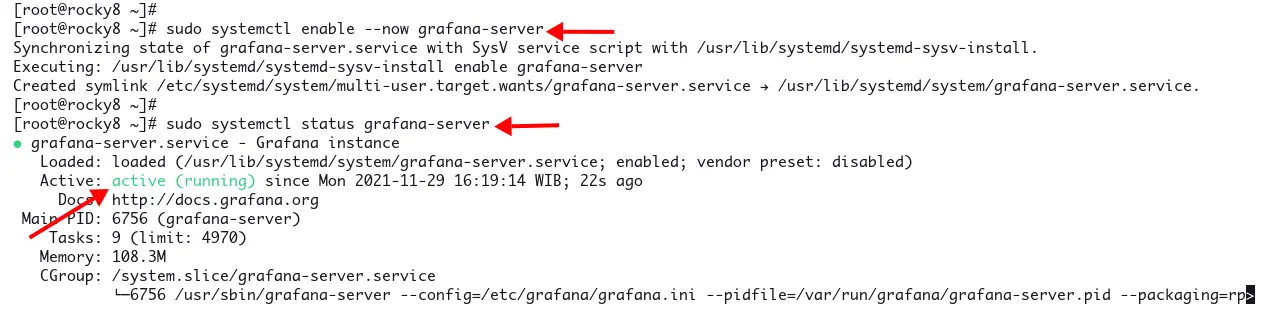
2. After installation completes, start and enable grafana service using the following command.
sudo systemctl enable --now grafana-server
Now verify the current status of the grafana service.
sudo systemctl status grafana-server
Ensure the current status of your grafana service is 'active (running)'.
3. Optionally, you can check the default grafana port '3000' using the ss command below.
ss -alntup | grep grafana
Now make sure the port '3000' is being used by the service named 'grafana-server'.
tcp LISTEN 0 128 *:3000 *:* users:(("grafana-server",pid=6756,fd=9))
Configuring Grafana
By default, the grafana service is running on the public IP address with port '3000'. To set up grafana with Nginx reverse proxy, change the default 'http_addr' on the grafana configuration to the 'localhost' and enable the 'domain' option to run grafana with a domain name.
1. Edit the grafana configuration '/etc/grafana/grafana.ini' using your preferable editor.
sudo nano /etc/grafana/grafana.ini
Change the default value of the option 'http_addr' to 'localhost', the 'http_port' to '3000', and the 'domain' option to your domain name as below. For this example, the domain name is 'grafana.example.io'.
[server]

# The IP address to bind to, empty will bind to all interfaces
http_addr = localhost

# The http port  to use
http_port = 3000

# The public facing domain name used to access grafana from a browser
domain = grafana.example.io
Save the configuration and exit.
2. Next, restart the grafana service to apply a new configuration.
sudo systemctl restart grafana-server
Now you've configured the grafana service to run the localhost with default port '3000' and the domain name 'grafana.example.io'.
Setup Nginx as a Reverse Proxy for Grafana
The following step explains how to set up Nginx as a reverse proxy for the Grafana. Also, the grafana server will be running on the secure HTTPS protocol.
1. Now execute the DNF command below to install Nginx packages.
sudo dnf install nginx -y
2. After you have installed Nginx, create a new server block for grafana '/etc/nginx/conf.d/grafana.conf' using your preferred editor.
sudo nano /etc/nginx/conf.d/grafana.conf
Copy and paste the following configuration. And make sure to change the domain name and SSL path with your own.
# this is required to proxy Grafana Live WebSocket connections.
map $http_upgrade $connection_upgrade {
  default upgrade;
  '' close;
}

server {
    listen      80;
    server_name grafana.example.io;
    rewrite     ^   https://$server_name$request_uri? permanent;
}

server {
  listen      443 ssl http2;
  server_name grafana.example.io;

  root /usr/share/nginx/html;
  index index.html index.htm;

  ssl_certificate /etc/letsencrypt/live/grafana.example.io/fullchain.pem;
  ssl_certificate_key /etc/letsencrypt/live/grafana.example.io/privkey.pem;

  access_log /var/log/nginx/grafana-access.log;
  error_log /var/log/nginx/grafana-error.log;

  location / {
    proxy_pass http://localhost:3000/;
  }

  # Proxy Grafana Live WebSocket connections.
  location /api/live {
    rewrite  ^/(.*)  /$1 break;
    proxy_http_version 1.1;
    proxy_set_header Upgrade $http_upgrade;
    proxy_set_header Connection $connection_upgrade;
    proxy_set_header Host $http_host;
    proxy_pass http://localhost:3000/;
  }
}
Save the configuration and exit.
3. Next, verify the Nginx configuration and make sure you don't get any errors.
sudo nginx -t
If your configuration is correct, you will see the message output 'syntax is ok' as below.
nginx: the configuration file /etc/nginx/nginx.conf syntax is ok
nginx: configuration file /etc/nginx/nginx.conf test is successful
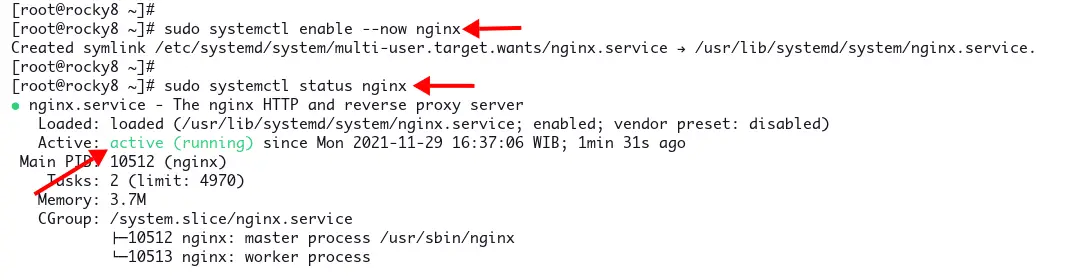
4. Now start and enable the Nginx service using the following command.
sudo systemctl enable --now nginx
Verify the Nginx service using the following command, and make sure it's 'active (running)'.
sudo systemctl status nginx
Verify Grafana Installation
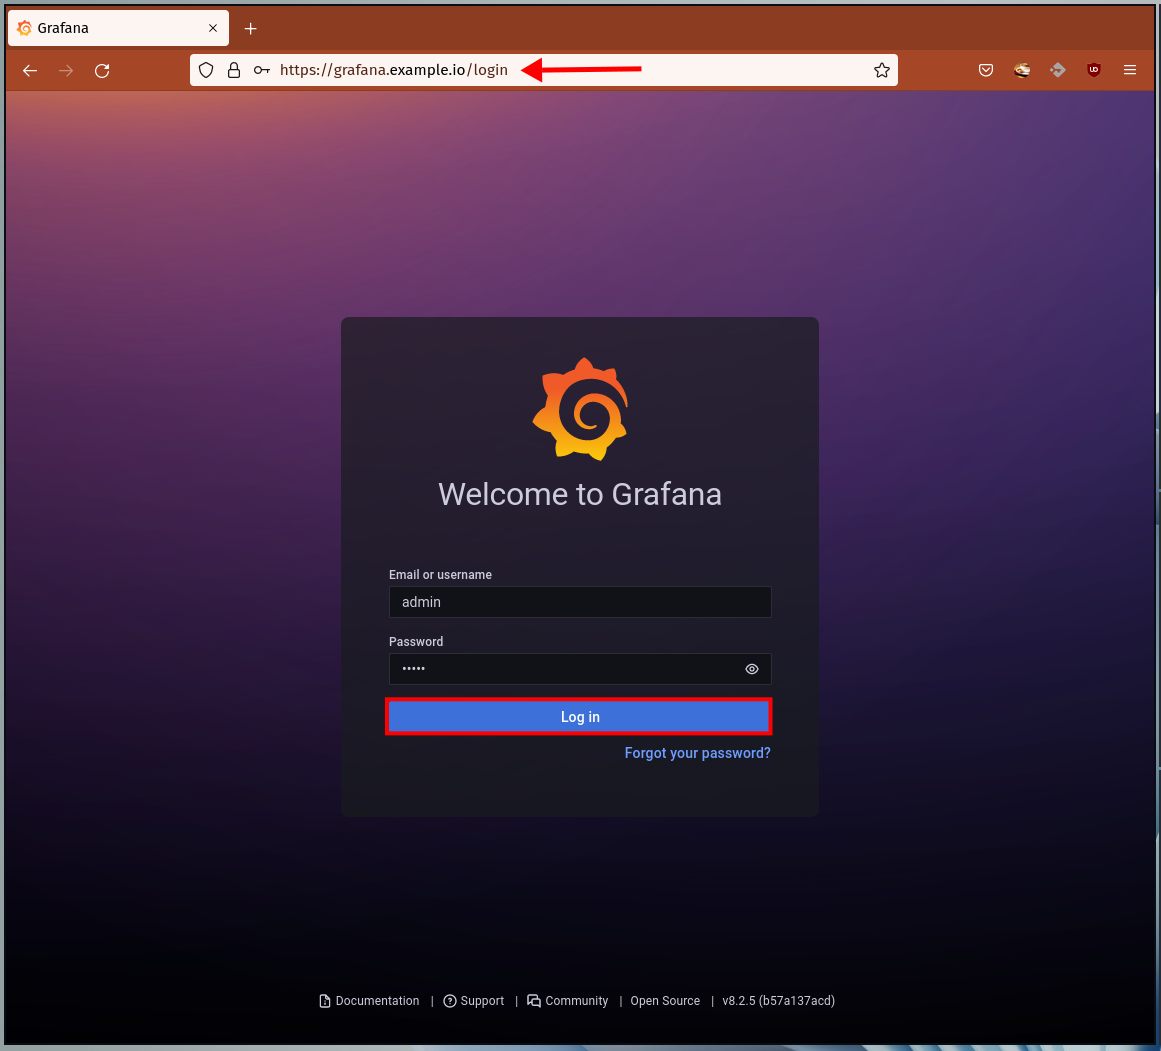
1. Open your web browser and type the grafana domain name on the address bar.
https://grafana.example.io
Log in with the default user 'admin' and password 'admin'.
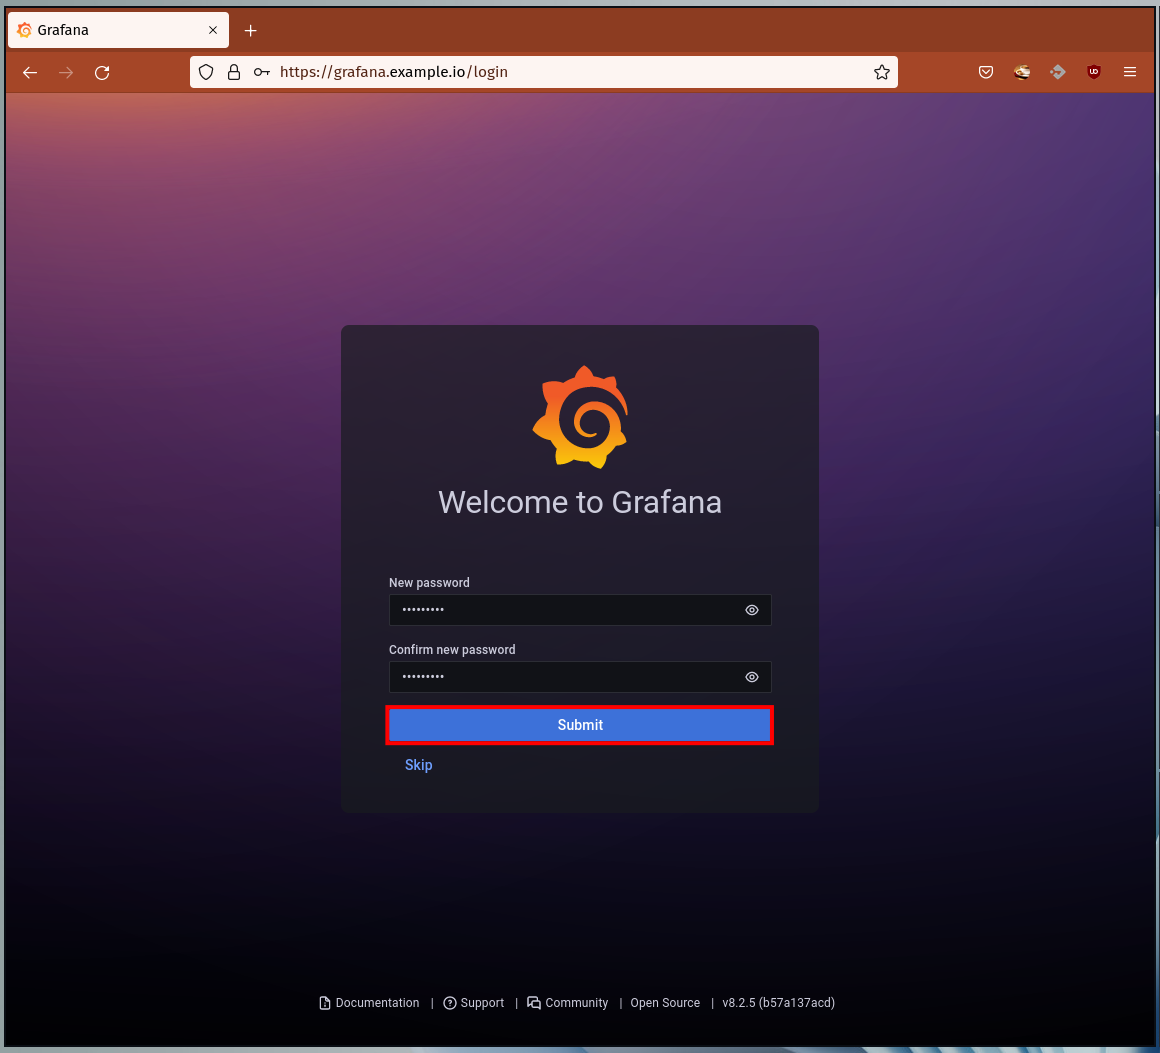
2. Change the default password with your new strong password and click the 'Submit' button.
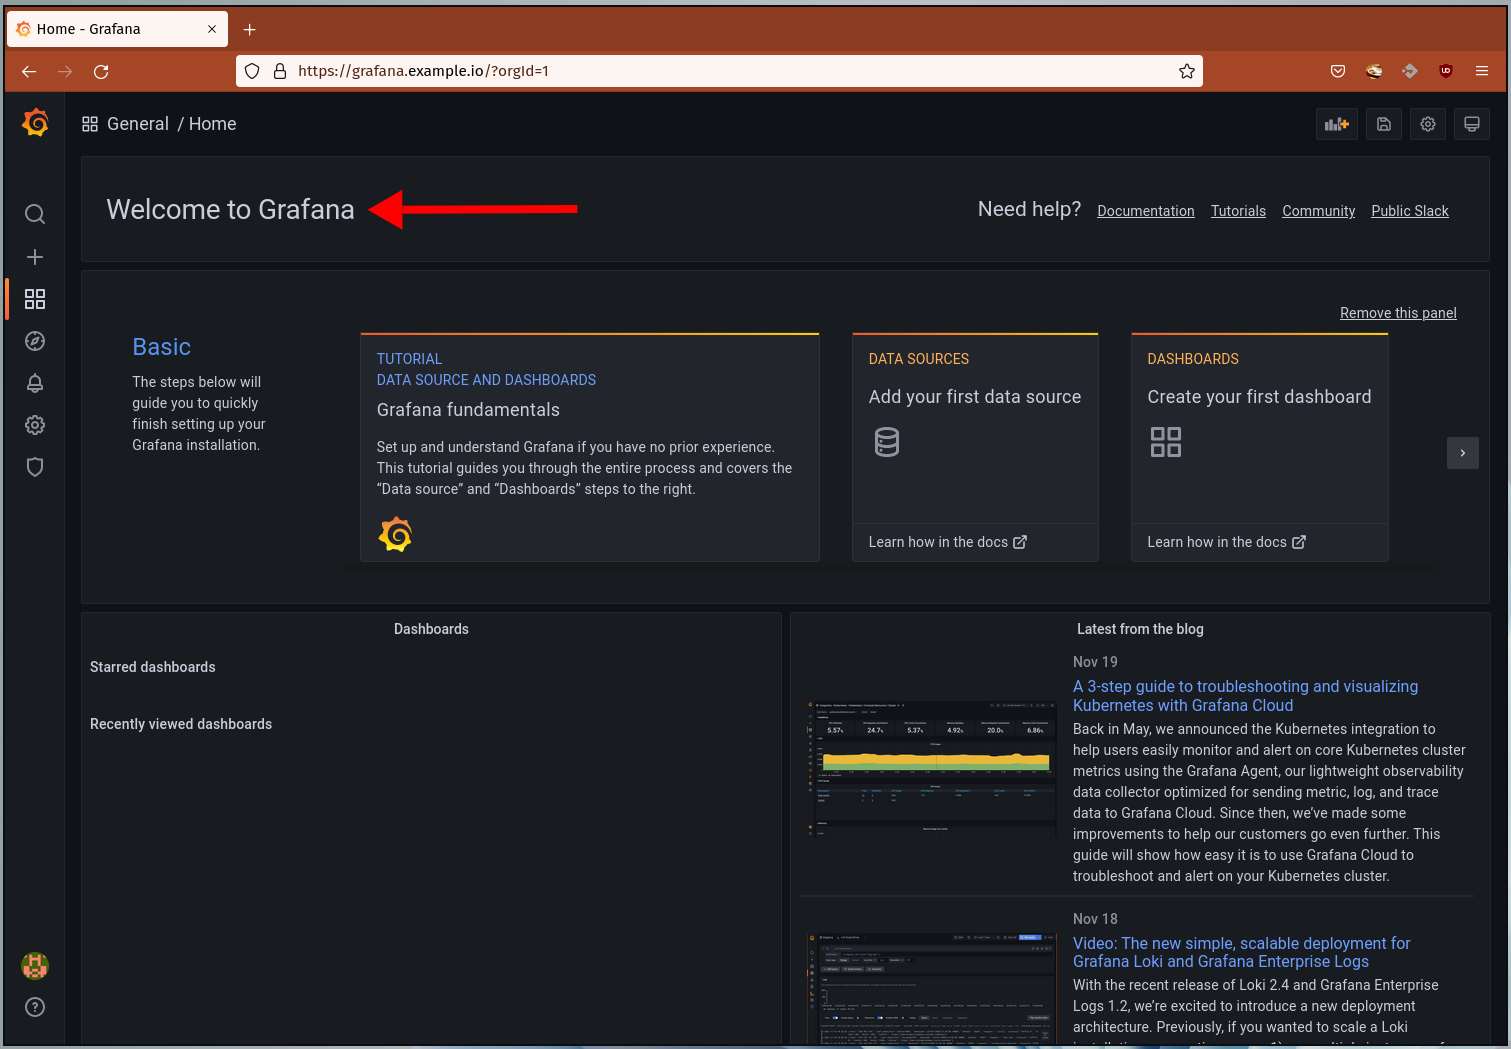
3. And you will see the default grafana dashboard as below.
Conclusion
Congratulation! You've learned the installation of Grafana on the Rocky Linux system with Nginx as a reverse proxy. For the next step, you can add your data source and create a new dashboard for your system and application monitoring.

